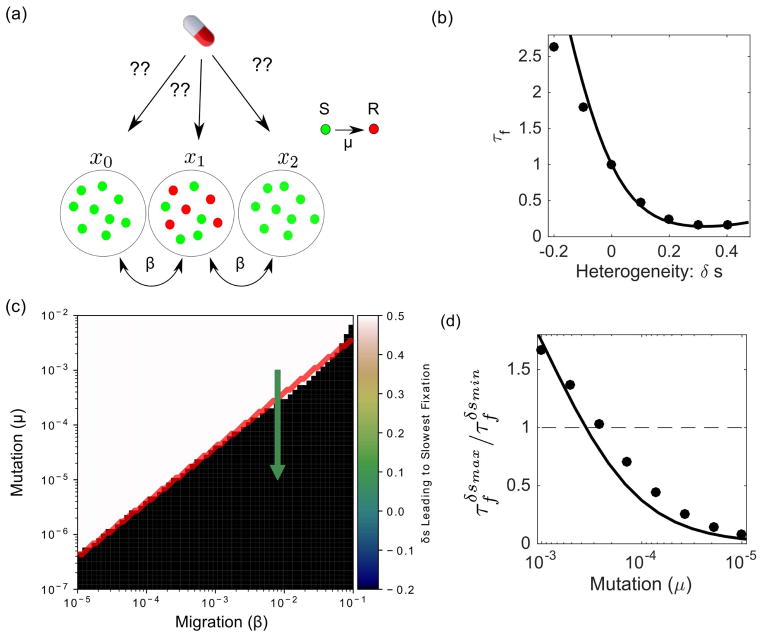
FIG. 3.
(a) Schematic: a subpopulation of resistant mutants (red) arises at a particular spatial location. How can one choose the spatial distribution of selection pressure (i.e. drug concentration) to maximize the time to fixation? (b) Heterogeneity can significantly speed or slow fixation starting from an initial resistant subpopulation consisting of N/2 cells in the center habitat (μ = 10−5, β = 8 × 10⁻³). Points, exact calculation; solid line, analytical approximation. (c) The optimal spatial heterogeneity (δs) leading to the slowest mean fixation time from an initial state of (0,N/2, 0). Depending on the specific parameter regime, the optimal selection pressure profile is the one with the largest possible valley consistent with 〈s〉 (black) or the one having the largest possible peak (white). Red solid line, analytical approximation. (d) Relative magnitude of (mean fixation time at maximum value of δs) and (mean fixation time at minimum value of δs) as mutation rate decreases at constant migration rate (green arrow, panel (c)). Points, exact calculation; solid line, analytical approximation. N = 24 and 〈s〉 = 0.167 in all panels. Analytical approximation is given in Equation S24.

