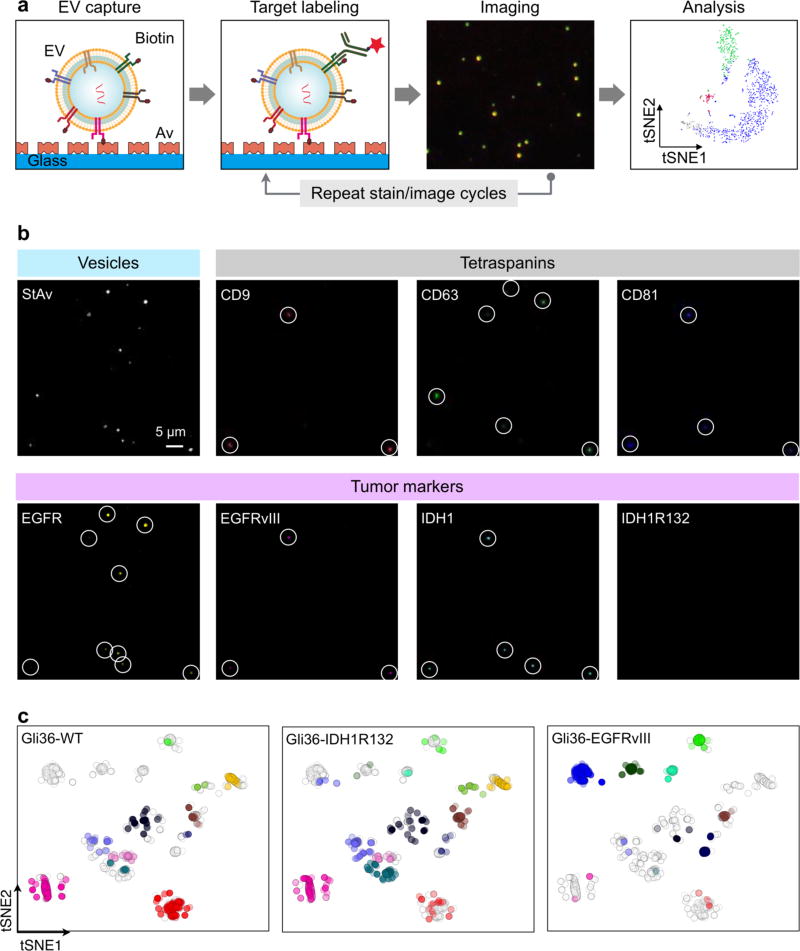
Figure 7. Single EV analysis (SEA).
(a) EVs are biotinylated and captured on a flat surface coated with neutravidin (Av). EVs are then stained with fluorescent antibodies and imaged. Subsequently, fluorophores are quenched and the staining process is repeated for a different set of markers. (b) Example SEA image. EVs from Gli36-WT cell line were biotinylated and captured. Individual EV were detected through staining with fluorescent streptavidin StAv (top left). For molecular profiling, EVs were stained for pan-EV markers (tetraspanins; CD9, CD63, CD81) as well as tumor markers (EGFR, EGFRvIII, IDH1, IDH1R132). Spots with circles indicate individual EVs. (c) 2-dimensional tSNE mapping of individual EVs analyzed for protein markers. The original map was redrawn for EVs from a single cell line. Data from other cell lines are shaded light gray. EVs from Gli36-WT and Gli36-IDH1R132 cells lines clustered similarly, whereas EVs from Gli36-EGFRvIII cells showed distinct clusters. Reprinted with permission from Ref 82. Copyright 2017 American Chemical Society.

