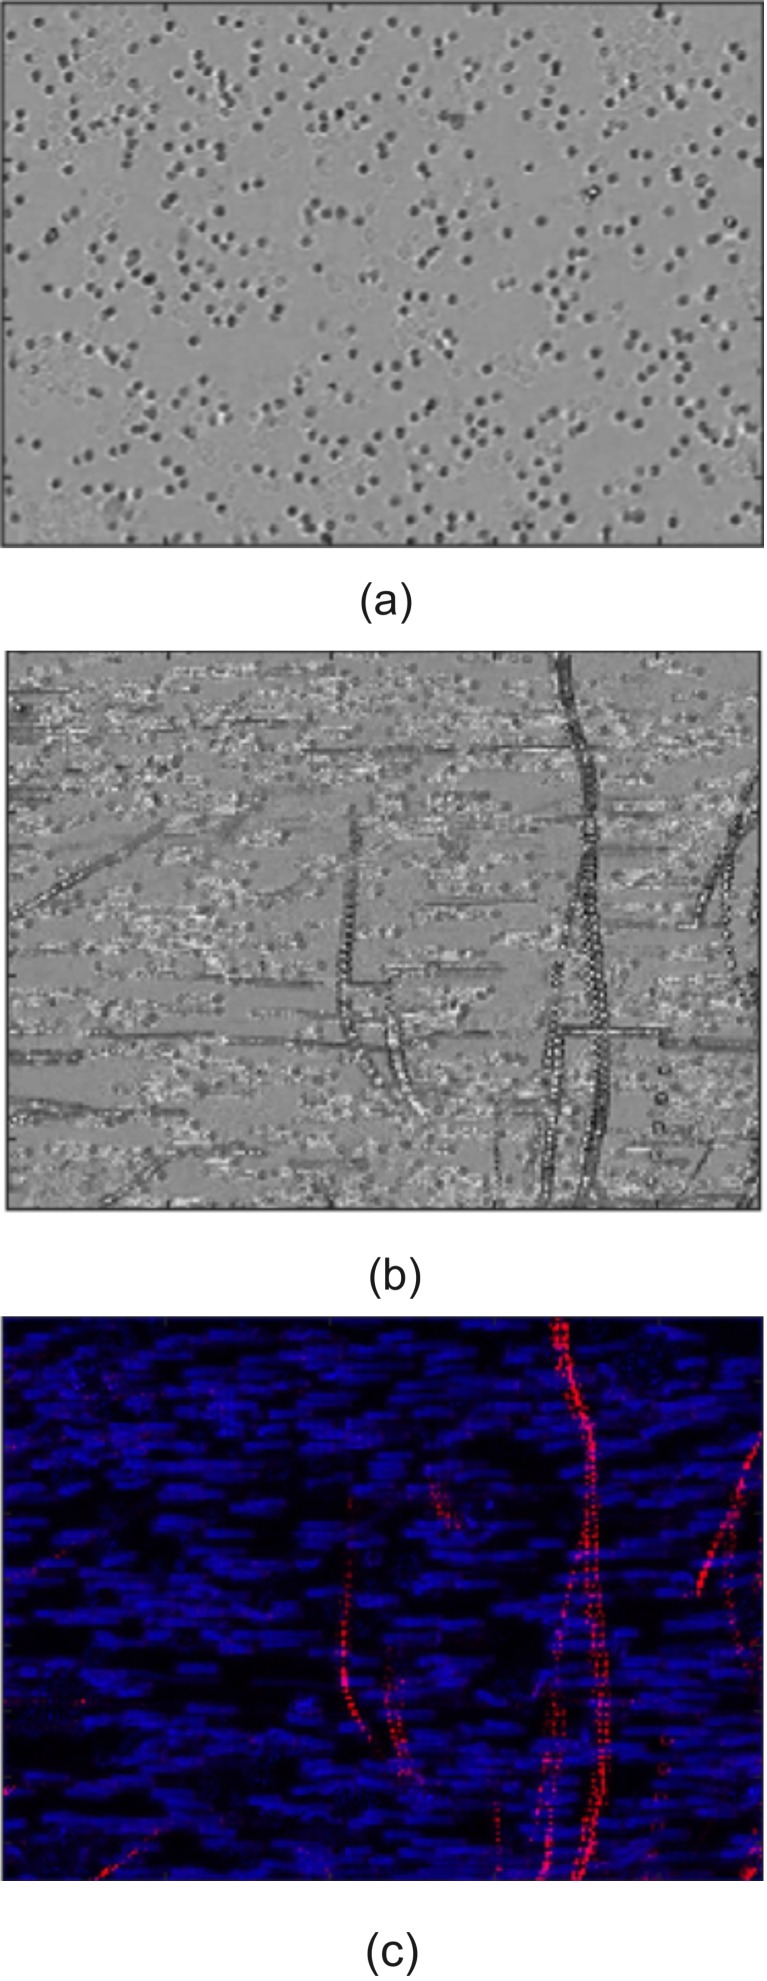
FIG. 12.
(Color online) Image processing of video data. (a) Raw microscope video image of cells (leukemia and erythrocytes). (b) Stacking all the images from the video shows cell tracks (movement was from top to bottom). Non-horizontal tracks are leukemia cells tagged with MBs) being pushed by an ultrasound pulse coming from above the image. (c) Processed data using velocity filtering so that high (relative) velocity is red, low velocity is blue. The tracks of individual leukemia cells can be distinguished from a multitude of untagged cells moving horizontally. Image is approximately 1 mm wide.

