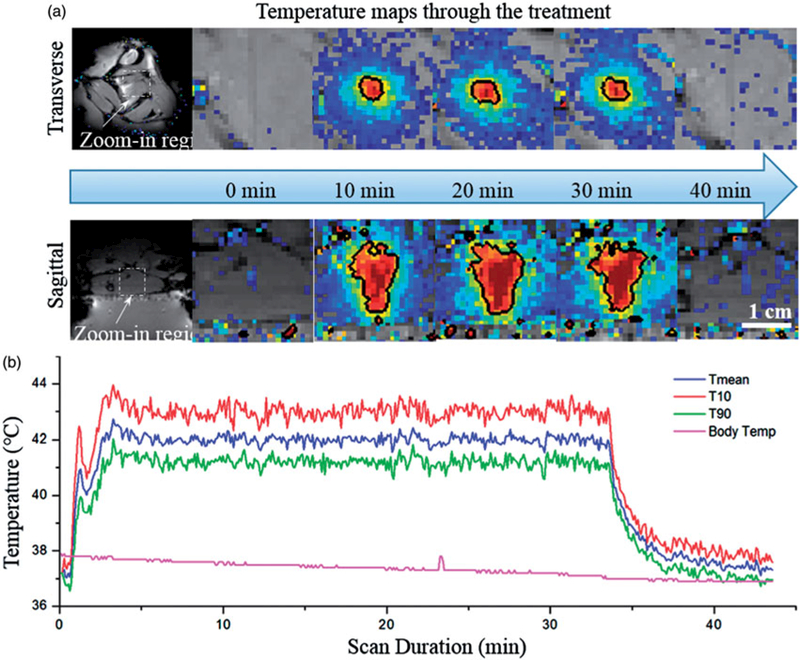
Figure 6.

Temperature maps and measurements during treatment. (a) Temperature maps in two perpendicular planes at different time points (0, 10, 20, 30 and 40 min). The black contour is the 42° isotherm which corresponds well to the desired treatment region. (b) Mean, T90, and T10 temperatures within the target ROI. A tight temperature range was achieved and the body temperature curve confirmed the effectiveness of the warming tray.
