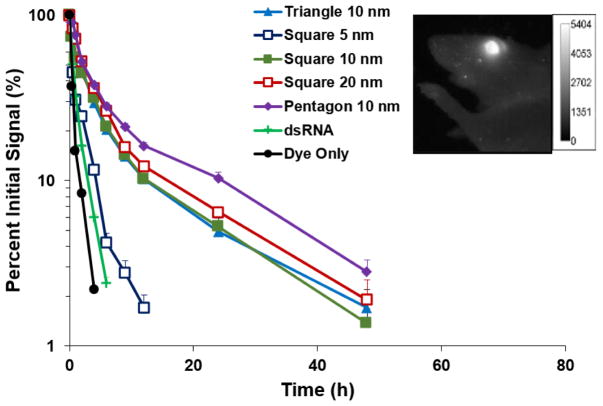
Fig. 2.
Relative signal versus time after subconjunctival injection in mouse eye in vivo of pRNA-Tri, pRNA-Sqr, and pRNA-Pent of 10 nm edge length and pRNA-Sqr of 5 and 20 nm edge lengths in PBS. Relative signal was calculated as the percent of signal at the time point to that at time t = 0. Mean ± SEM (n = 3–5; except for pRNA-Sqr 10 nm, n = 9). Figure insert: representative whole-body image of the eye at 9 h after subconjunctival injection of pRNA-Pent on a mouse in vivo.

