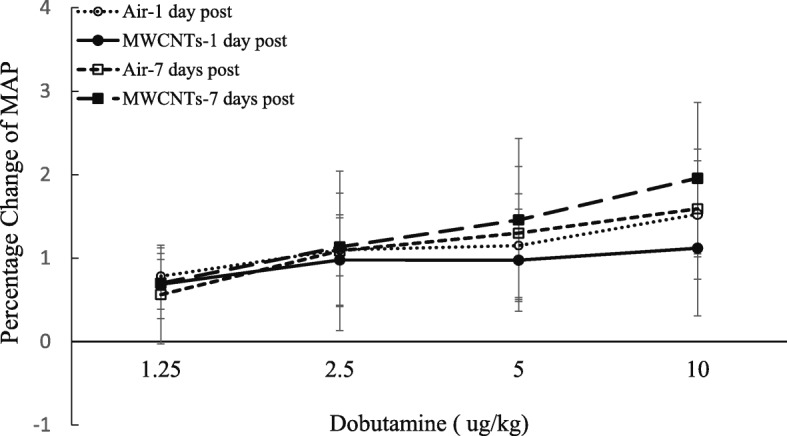
Fig. 6.

Line graph depicting a percentage change of mean blood pressure (MBP) from the basal level before exposure (control vs MWCNTs at 1 day post: 97.7 ± 2.8 vs 98.1 ± 2.6, control vs MWCNTs at 7 days post: 102.5 ± 4.2 vs 100.9 ± 5.5). Each value represents the mean ± SE of eight rats
