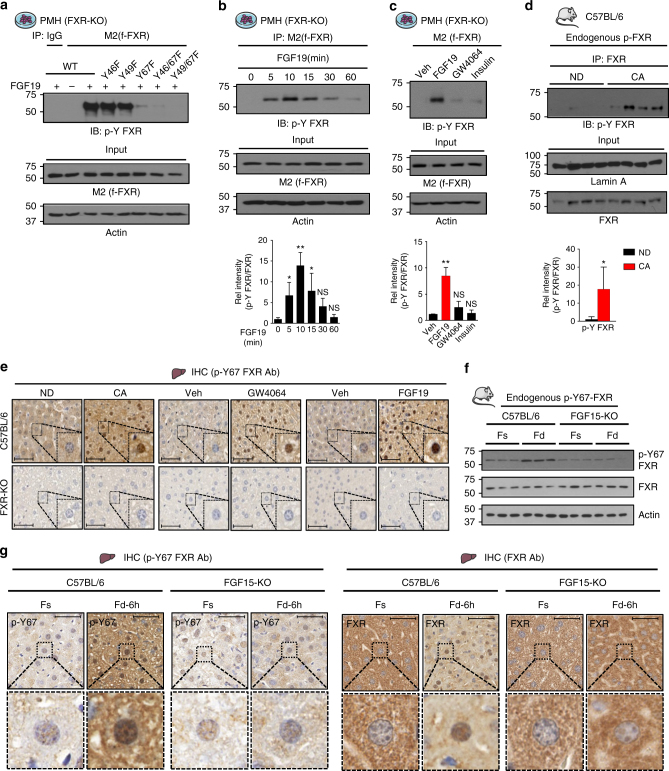
Fig. 1.
FXR is phosphorylated at Y67 by FGF19. a Flag-FXR-WT, or its Tyr-FXR mutants as indicated, was expressed in PMH from FXR-KO mice. Cells were treated with vehicle or 50 ng ml−1 FGF19 for 10 min, and p-Y-FXR levels were detected by IP/IB. b PMH expressing flag-FXR were treated with FGF19 for the indicated times, and FXR phosphorylation levels were determined by IP/IB. Relative p-Y-FXR to total FXR levels are shown at the bottom (n = 3). c PMH expressing flag-FXR were treated with vehicle or 50 ng ml−1 FGF19, GW4064 (0.5 μM), or insulin (100 nM) for 10 min, and p-Y-FXR levels were determined by IP/IB. The p-Y-FXR level in the vehicle-treated sample was set as 1. Relative p-Y-FXR levels are shown at the bottom (n = 3). d C57BL/6 mice were fed a normal chow diet (ND) or 0.5% cholic acid (CA) chow for 3 h after 12 h of fasting and p-Y-FXR levels were detected by IP/IB. Relative p-Y-FXR levels are shown at the bottom (n = 4). e C57BL/6 mice or FXR-KO mice were fed a ND or 0.5% CA chow for 6 h or were fasted for 12 h and then treated with GW4064 (3 h) or FGF19 (30 min). The p-Y67-FXR levels in liver sections were detected by IHC. Scale bar, 50 µm. f, g C57BL/6 mice or FGF15-KO mice were fasted for 12 h (Fs) or fed for 6 h (Fd) after fasting. f p-Y67 FXR and FXR levels were measured by IB (n = 3). g p-Y67-FXR or FXR levels in liver sections were detected by IHC. Scale bar, 50 µm. All values are presented as mean ± SD. Statistical significance was measured using the d Mann–Whitney test, b, c one-way ANOVA with the Bonferroni post-test. *P < 0.05, **P < 0.01, and NS, statistically not significant

