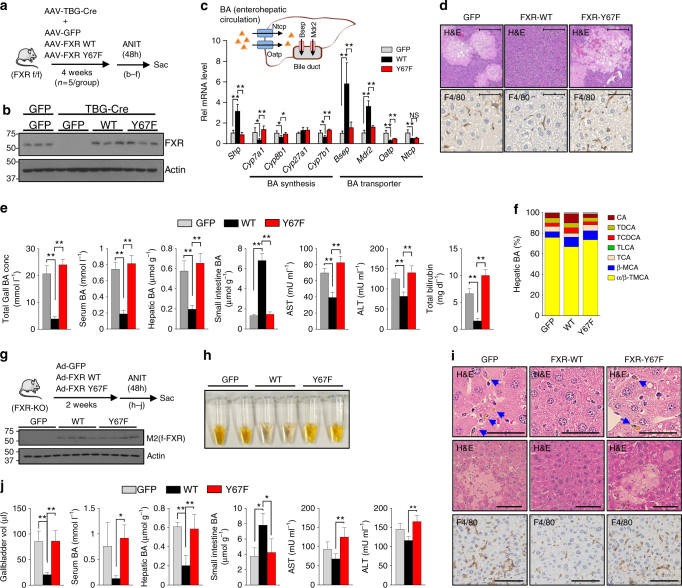
Fig. 3.
Y67F-FXR expression impairs response to induced cholestasis. a–f FXR-WT or Y67F-FXR was expressed in the livers of FXR floxed mice as in Fig. 2a and mice were treated with ANIT for 48 h (5 mice/group). a Experimental outline. b Levels of FXR in liver extracts detected by IB. c The mRNA levels of indicated genes in the liver. Diagram of liver BA transporters (top). d Liver sections were stained with H&E (top) and F4/80 antibody (bottom). Scale bar, 300 µm (H&E) and 50 µm (F4/80). e BA levels in the gallbladder, serum, liver, and intestine and serum AST, ALT and total bilirubin levels. f BA composition in the liver. g–j FXR-WT, Y67F-FXR, or GFP were adenovirally expressed in FXR-KO mice and the mice were treated with ANIT for 48 h (6 mice/group). g Experimental outline (top) and protein levels of FXR in liver extracts (n = 4). h Serum color from 2 mice in each group. i Liver sections were stained with H&E and F4/80 antibody. At the top, abnormally accumulated bile acids are indicated by the blue arrows. Scale bar, 50 µm (top), 100 µm (middle and F4/80). j The volume of the gallbladder, BA levels in serum, liver, and small intestine and serum AST and ALT levels. c, e, j All values are presented as mean ± SD (n = 5 or 6 mice). Statistical significance was measured using one-way ANOVA with the Bonferroni post-test. *P < 0.05, **P < 0.01, and NS statistically not significant

