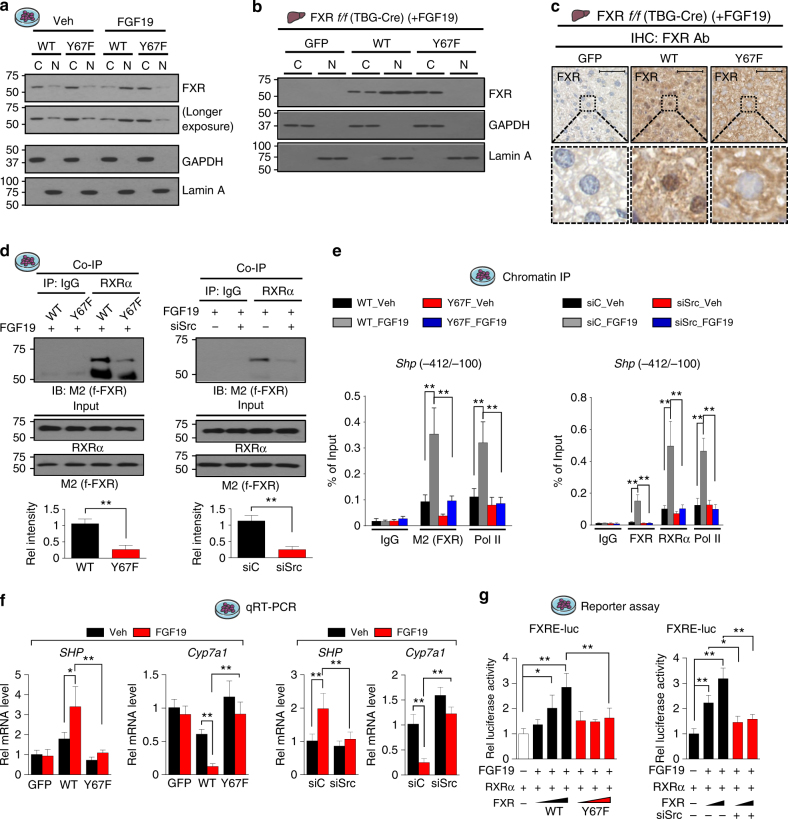
Fig. 5.
Phosphorylation of FXR at Y67 is important for its function. a PMH expressing FXR-WT or Y67F-FXR were treated with vehicle or FGF19 for 10 min and nuclear (N) and cytoplasmic (C) extracts were isolated. Levels of FXR in N or C fractions was measured by IB. b, c FXR-WT or Y67F-FXR was expressed in FXR-floxed mice infected with AAV-TBG-Cre as in Fig. 2a, and the mice were treated with FGF19 for 30 min. b Levels of FXR in nuclear and cytoplasmic liver extracts were determined by IB (n = 2). c FXR levels in liver sections were detected by IHC. Scale bar, 50 µm. d PMH from FXR-KO mice were infected with Ad-flag FXR WT or Y67F-FXR (left) or transfected with siRNA for Src (right) and then, treated with FGF19 for 30 min. FXR in anti-RXRα immunoprecipitates was detected by IB. Band intensities are shown on the bottom with the WT and siC values set to 1 (n = 3). e, f Flag-FXR-WT or Y67F-FXR was adenovirally expressed in PMH from FXR-KO mice (left), or endogenous Src was downregulated by siRNA in PMH from C57BL/6 mice (right). Then, cells were treated with vehicle or FGF19 for 30 min. e Occupancy of flag-FXR and RNA pol II was detected by ChIP, and f mRNA levels of Shp and Cyp7a1 were measured by qRT-PCR (n = 3–5). g PMH were transfected with plasmids or siRNA as indicated and treated with vehicle or FGF19 for 3 h and the luciferase activities were measured and normalized to β-galactosidase activities (n = 4). All values are presented as mean ± SD. Statistical significance was measured using the d Mann–Whitney test, g one- or e, f two-way ANOVA with the Bonferroni post-test. *P < 0.05, **P < 0.01

