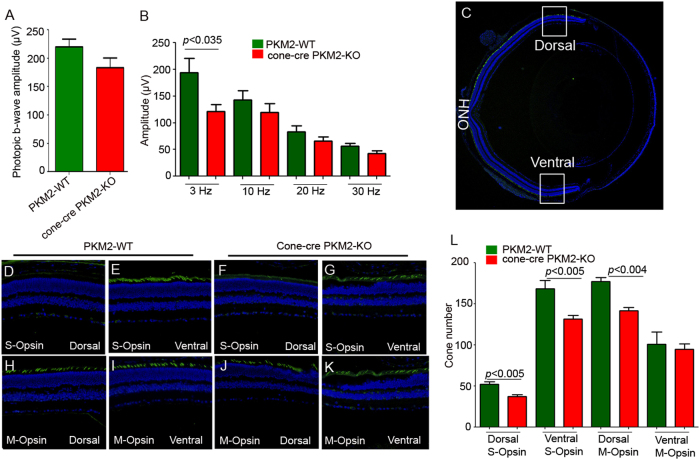
Fig. 4. The function and structure of the 12-week-old cone-cre PKM2-KO mouse retina.
Cone function (photopic b-wave) and cone flicker electroretinographic analysis were performed on 12-week-old PKM2-WT and cone-cre PKM2-KO mice. Photopic b-wave amplitudes were performed at a flash intensity of 3.3 log cd s/m2 (a). Isolated cone photoreceptor components of the photopic flicker ERG were done at 3, 10, 20, and 30 Hz (b). Panel (c) represents staining of the retina with M-opsin (green) and nuclei (blue) on a section of PKM2-WT retina at 12 weeks (Scale bar = 100 μm). Higher expression of M-opsin dorsally than ventrally. Panels (d–k) represent the difference of expression of S-opsin (S-opsin positive cones) and M-opsin (M-opsin positive cones) in dorsal and ventral regions of the retina from 12-week-old PKM2-WT and cone-cre PKM2-KO mice. Panel (l) represents the quantification of the number of cones in dorsal and ventral regions of the retina counted starting from the optic nerve head (ONH). Data are mean ± SEM (n = 6). Significance, if any, is indicated on each panel. The images shown are representative of six retinas examined from PKM2-WT and cone-cre PKM2-KO mice

