Fig. 2.
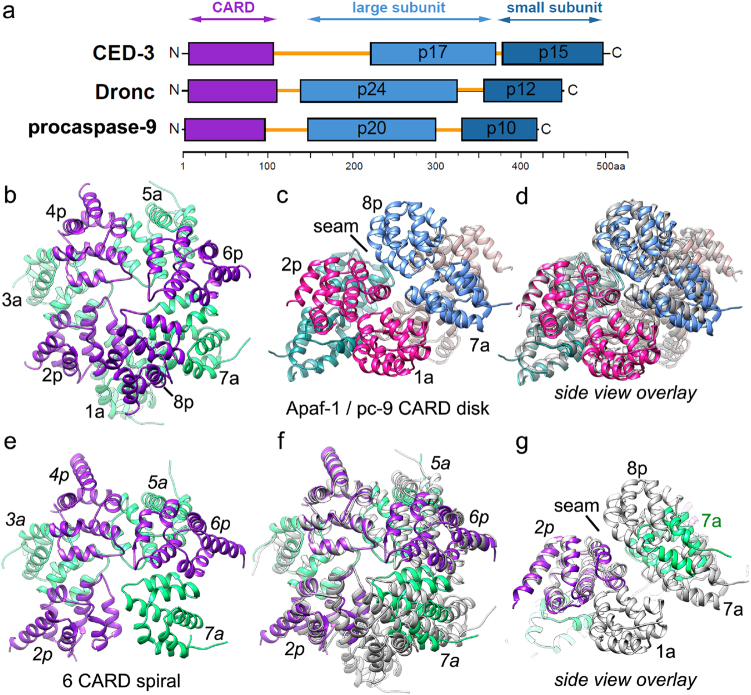
Apical procaspase diagrams and a comparison of CARD disks formed by Apaf-1 and pc-9 CARDs. a A schematic representation is shown for apical procaspases from C. elegans, D. melanogaster, and H. sapiens. Domains are color-coded with linker regions highlighted in gold. b, c Top and side views are shown of an Apaf-1/pc-9 8 CARD disk from an active human apoptosome (PDB 5JUY). CARD pairs 1a/2p, 3a/4p, 5a/6p, and 7a/8p are labeled. A seam or dislocation in the helical lattice between 1a/7a and 2p/8p is indicated in b. d An overlay is shown of two 8 CARD disk structures with the more recent model in gray (PDB 5WVE). e A top view is shown of a 6 CARD spiral from a crystal structure (PDB 5WVC) annotated with the relevant positions in the CARD disk from the apoptosome. f, g Overlays are shown between the 6 CARD spiral and an 8 CARD disk after aligning them on position 2p. The match between the two structures becomes somewhat worse as one moves around the left-handed spiral with the Apaf-1 CARD at position 7a in the 6 CARD spiral displaced vertically from its counterpart in the disk

