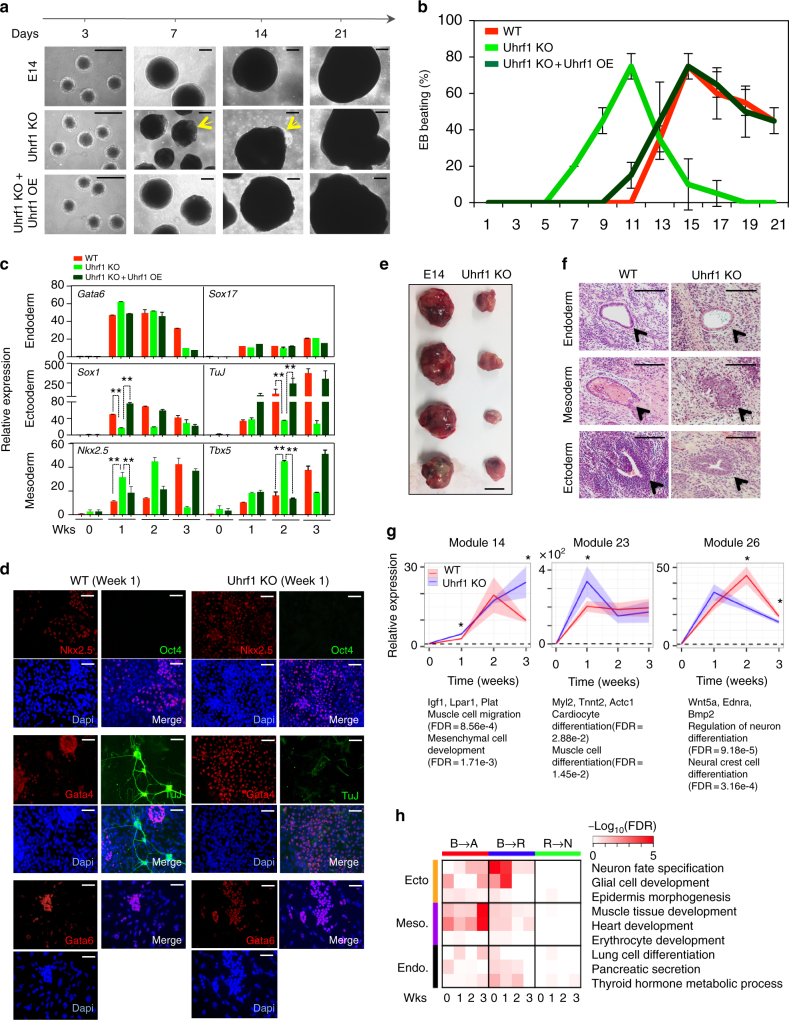
Fig. 2.
Uhrf1 deficiency induces neural differentiation defects. a In vitro EB formation of WT, Uhrf1 KO, and Uhrf1 KO ESCs expressed with Uhrf1. ESCs were differentiated for 3 weeks as EBs. Arrows indicate the cystic hollow. The scale bar represents 4 mm. b Appearance of spontaneous contractile activity during EBs growth. EBs were examined daily under the microscope for the presence of a rhythmic beating until day 21. Data are from n = 3 independent experiments. c qPCR analysis of lineage- specific markers and pluripotency marker upon in vitro differentiation. Data are expressed relative to WT ESCs values and values are normalized to β-actin. Data are from n = 3 independent experiments. The data values are mean ± s.d. **P < 0.05 by unpaired, two-tailed Student’s t-test analysis. d Immunostaining of differentiated EBs. EBs were treated with Trypsin–EDTA at EB week 1 and plated onto gelatin-coated plates. Immunostaining with lineage-specific markers was performed 2 days after plating. The scale bar represents 4 mm. e Teratomas derived from immune deficiency mice. Scale bar represent 1 cm. f Representative histological sections from teratomas that developed in immunodeficient mice following injection with WT and Uhrf1 KO ESCs. Haematoxylin and eosin (H&E) staining reveal characteristic tissues from the endoderm, mesoderm, and ectoderm. The data are represented as n = 6 experimental replicates. The Scale bar represents 4 mm. g Expression pattern of transcriptional modules related to muscle differentiation and neuronal differentiation. Thick red and blue lines represent average relative gene expression to WT at week 0 in WT and Uhrf1 KO, respectively. Ribbon colors represent SEM. Representative genes and overrepresented GO terms are shown. Asterisk (*) represents significant difference (>1.25 fold change and Student’s t-test p-value < 0.05) of gene expression between WT and Uhrf1 KO in each module. h Disruption of bivalent and repressive promoters in developmental genes. Over representation of GO terms in genes with changes from bivalent to active (B–A) and to repressive (B–R) and from repressive to no mark (R–N) is shown by heat colors

