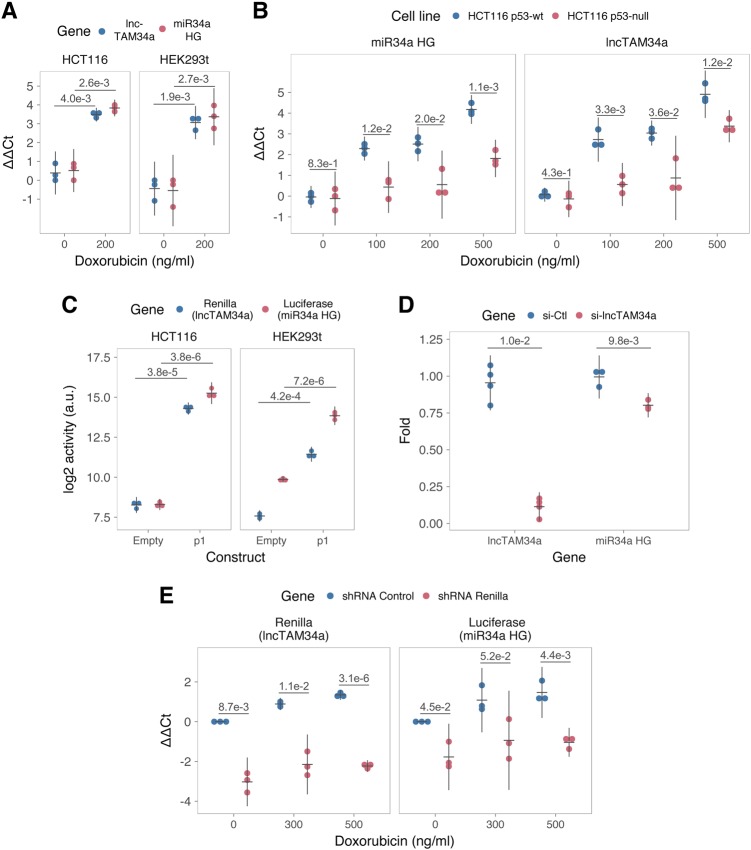
Fig. 2. TP53-mediated regulation of the miR34a locus.
a Evaluating the effects of 24 h of treatment with 200 ng/ml doxorubicin on lncTAM34a and miR34a HG in HCT116 and HEK293T cells.* b Monitoring miR34a HG and lncTAM34a expression levels during 24 h of doxorubicin treatment in TP53+/+ and TP53−/− HCT116 cells.* c Quantification of luciferase and renilla levels after transfection of HCT116 and HEK293T cells with the p1 construct (Fig. 2-Supplement 2 contains a schematic representation of the p1 construct).* d lncTAM34a (n = 4) and miR34a HG (n = 3) levels after 48 h siRNA-mediated knockdown of lncTAM34a in U2OS cells.* e HCT116 cells were co-transfected with the p1 construct and shRNA renilla or shRNA control and subsequently treated with increasing doses of doxorubicin. Twenty-four hour posttreatment, cells were harvested and renilla and luciferase levels were measured using QPCR.* *Individual points represent results from independent experiments, error bars show the 95% CI, black horizontal lines represent the mean, and p values are shown over long horizontal lines indicating the comparison tested. All experiments in Fig. 2 were performed in biological triplicate unless otherwise stated

