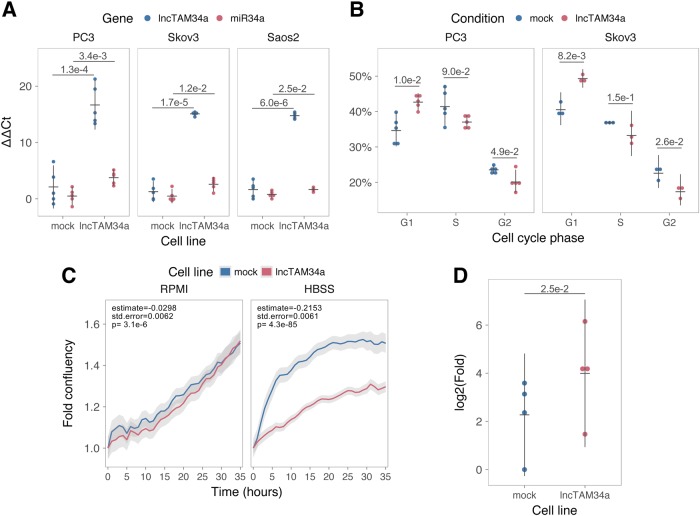
Fig. 3. lncTAM34a positively regulates miR34a and its associated phenotypes.
a QPCR-mediated quantification of miR34a expression in cell lines stably overexpressing lncTAM34a.* b Cell-cycle analysis comparing stably overexpressing lncTAM34a cell lines to the respective mock control.* c Analysis of cellular growth over time in lncTAM34a overexpressing PC3 cells. Fold confluency (% confluency/time 0 % confluency) is indicated on the y-axis. Colored lines indicate the polynomial regression model where mean fold confluency from three independent experiments was modeled as a function of time and cell line. The grey shadows illustrate the 95% confidence interval for the regression. Estimates, standard error (std.error), and p values for the cell line covariate for each model are indicated in the upper left hand corner. d Differential phosphorylated polymerase II binding in lncTAM34a overexpressing PC3 cells.* *Individual points represent results from independent experiments, error bars show the 95% CI, black horizontal lines represent the mean, and p values are shown over long horizontal lines indicating the comparison tested

