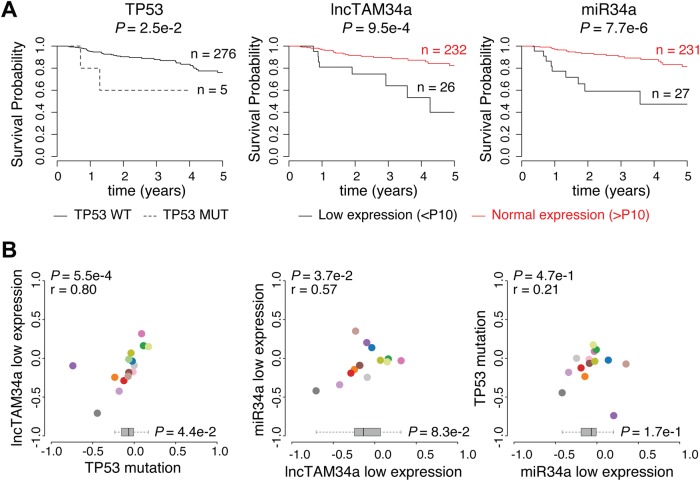
Fig. 4. Survival analysis in TCGA cancers.
a Kaplan-Meier survival curves comparing the effects of TP53-mutated samples (left), low-lncTAM34a expression (middle) and low-miR34a expression (right) to control samples in papillary kidney cancer (results for other cancers in Fig. 4-Supplement 1). Middle and right panel include only TP53 wild-type patients where RNAseq data exists. b Correlation analysis between the effects on the 5-year survival probability of TP53-mutated samples, low-lncTAM34a expression, and low-miR34a expression as indicated. For each variable the 5-year survival probability was compared to the control group (negative values indicate lower survival and positive values indicate higher survival). Spearman correlation coefficients are given on top left of each plot. Each dot indicates one cancer type (see Fig.1c for legend). Boxplots on the bottom summarize the effects for the parameter on the x-axis, with indication of p values, as calculated using paired Wilcoxon signed rank test. Low expression was defined as TP53 nonmutated samples having expression values in the bottom 10th percentile

