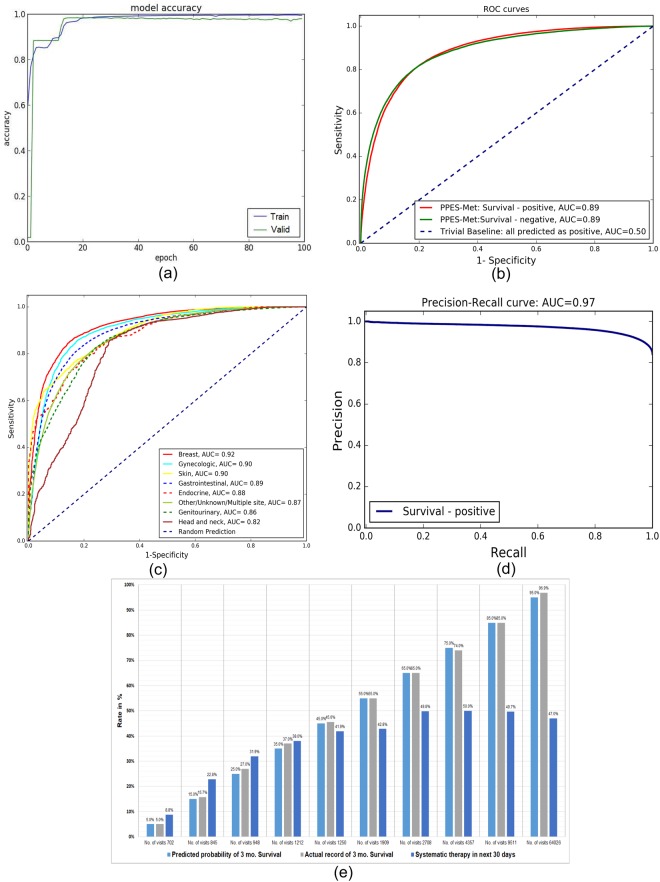
Figure 3.
Overall quantitative performance. (a) Epoch based performance accuracy. (b) ROC curve on the test set without padding values. (c) ROC curves on the test set separated based on the primary site. (d) Precision-Recall curve on the test set without padding values. (e) Correlation between predicted probability and actual survival rates, compared with systematic therapy information in next 30 days shows that many patients are getting aggressive therapy when the rate of survival is limited while the rate of systemic therapy utilization plateaus at around 50% for patients with high expected survival.

