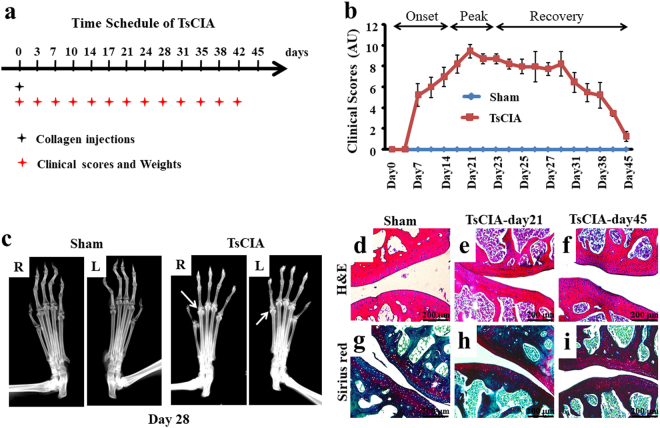
Figure 1.
Establishment of tree shrew collagen-induced arthritis (TsCIA). (a) Time schedule for the establishment of TsCIA. (b) Clinical scores of the control and TsCIA groups (n = 20 tree shrews per group). AU indicates arbitrary unit. (c) Representative X-ray images from control and TsCIA forelimbs at day 28. R, right and L, left. Arrows indicate damaged joints in TsCIA. (d–i) Histochemical analysis of joint cross-sections from the same tree shrews shown at day 21 and day 45. H&E staining shows the endogenous chondrocytes in (d–f). Sirius red and solid green staining show cartilage damage (arrows) in (g–i). Scale bar, 200 μm.

