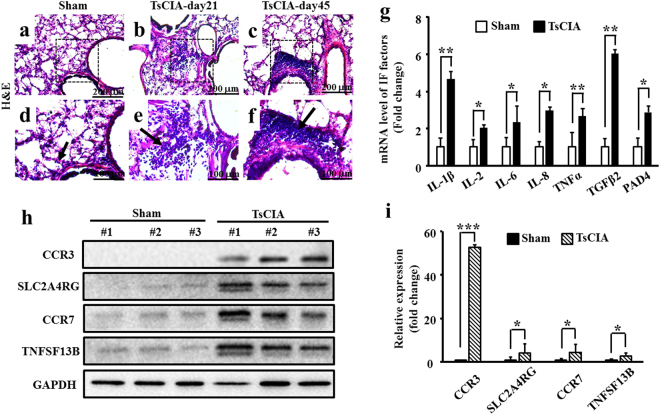
Figure 2.
Pulmonary inflammation in TsCIA. (a–f) The PBMCs were detected in TsCIA lungs at day 21 and day 45. Arrows indicate infiltrated PBMCs. Scale bar: 200 μm (a–c); 100 μm (d–f). (g) Quantification of mRNA levels of lung inflammatory factors (n = 4 tree shrews per group, *p < 0.05, **p < 0.01. Error bars indicate SEM). (h) Protein expressions of inflammatory factors in the TsCIA lungs detected by Western blot analysis. (i) Semi-quantification of the relative expression levels of CCR3, SLC2A4RG, CCR7, and TNFSF13B proteins, normalized to GAPDH compared with the control tree shrews from F (n = 4 tree shrews per group, *p < 0.05, ***p < 0.001. Error bars indicate SEM).

