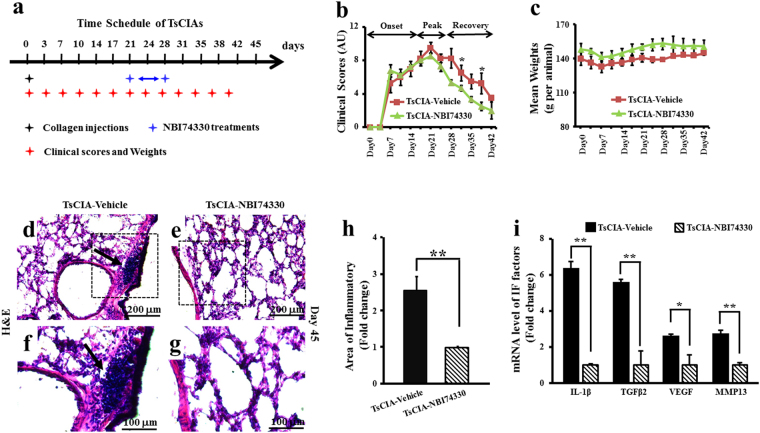
Figure 4.
Recovery of TsCIA following in vivo treatment with NBI74330. (a) Time schedule for NBI74330 treatment in TsCIA. (b) Clinical scores of TsCIA treated with CXCR3-specific antagonist NBI74330 in (a) (n = 4 tree shrews per group, *p < 0.05). AU indicates arbitrary unit. (c) Average body weights. (d–g) H&E images of lung tissues in vehicle- or NBI74330-treated TsCIA at day 21. Infiltrated PBMCs are indicated by arrows. Scale bar: 200 μm (d and e) and 100 μm (f and g). (h) Infiltrated cell area was compared between TsCIA and TsCIA-NBI74330 by NIH ImageJ software (**p < 0.01. Error bars indicate SEM). (i) Quantification of mRNA levels of the inflammatory factors in TsCIA lungs and TsCIA-NBI74330 lungs (n = 4 tree shrews per group, *p < 0.05, **p < 0.01. Error bars indicate SEM).

