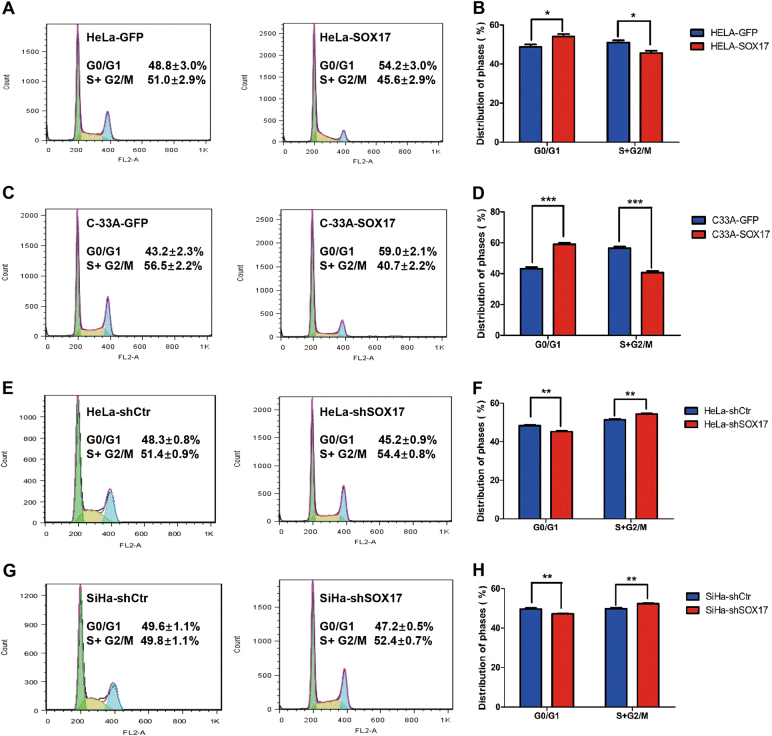
Fig. 4. SOX17 inhibits the proliferation of cervical carcinoma cells through arresting at the cell transition from G0/G1 phase to S phase.
In the flow cytometry figures, the y axis shows the count of effective cells and the x axis shows the DNA content. Each colored area represents the cells of different phases of cell cycle: green area refers to the cells in the G0/G1 phase, yellow area refers to the cells in the S phase and blue area refers to the cells in the G2/M phase. The cell cycles of HeLa-GFP and HeLa-SOX17 cells were analyzed using flow cytometry (a), and a quantitative analysis of the cell cycle are shown (b). The cell cycles of C33A-GFP and C33A-SOX17 cells (c) and the quantitative analysis (d) are shown . The cell cycles of HeLa-shControl and HeLa-shSOX17 cells (e) and the quantitative analysis (f) are shown. The cell cycles of SiHa-shControl and SiHa-shSOX17 cells (g) and the quantitative analysis (h) are shown. The data were shown as the mean ± SD of three independent experiments. *p < 0.05, **p < 0.01, ***p < 0.001 vs. control using One-Way ANOVA

