Figure 1.
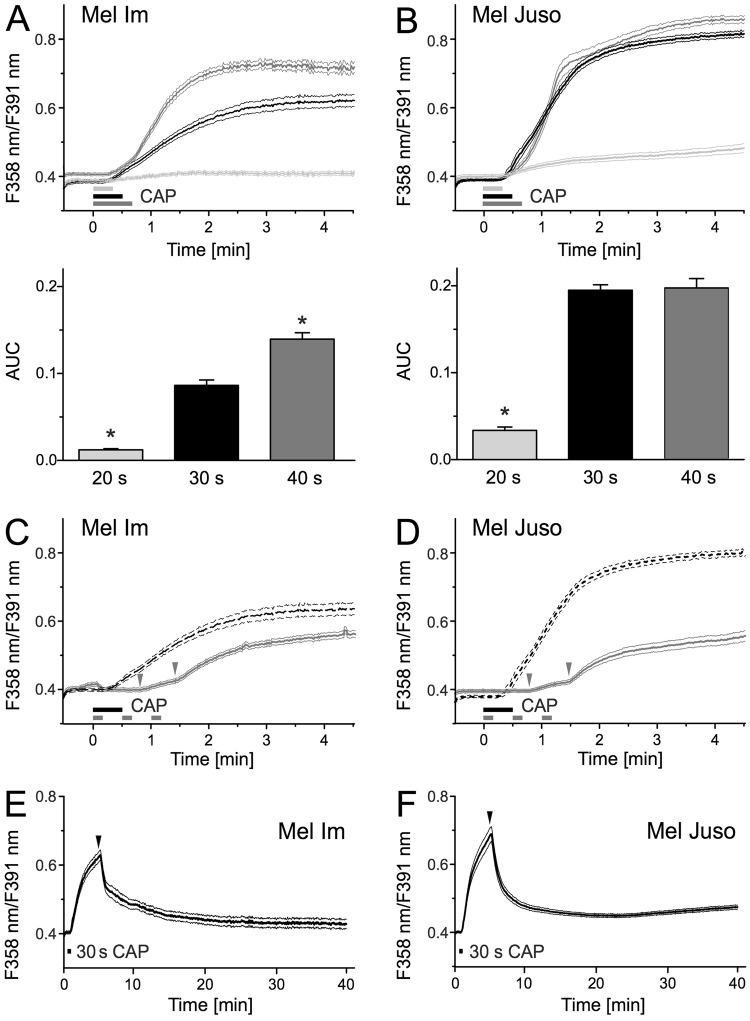
CAP treatment leads to a delayed Ca2+ influx. Cytoplasmic Ca2+ time courses were measured using fura-2 AM. CAP exposure for 20 s, 30 s and 40 s elevated cytoplasmic Ca2+ in Mel Im (A, n = 500–660) and Mel Juso (B, n = 280–503). The area under the curve (AUC) of the first 90 s of this response was quantified in the bar charts. (C) Mel Im (n = 299) and (D) Mel Juso (n = 261) show the response pattern more clearly when the 30 s exposure (as in A,B for reference, dotted line) is fractionated into 3 times with 10 s CAP as indicated by the grey bars. The grey arrows mark the delay of the Ca2+ response. (E,F) Long-term measurement of cytoplasmic Ca2+ after treatment of Mel Im ((E), n = 275) and Mel Juso ((F), n = 353) with 30 s CAP. PbECS (1 ml) was added 5 minutes after the start of recording, represented as black arrows. Data are shown as mean and 99% confidence interval. N indicates the investigated number of cells.

