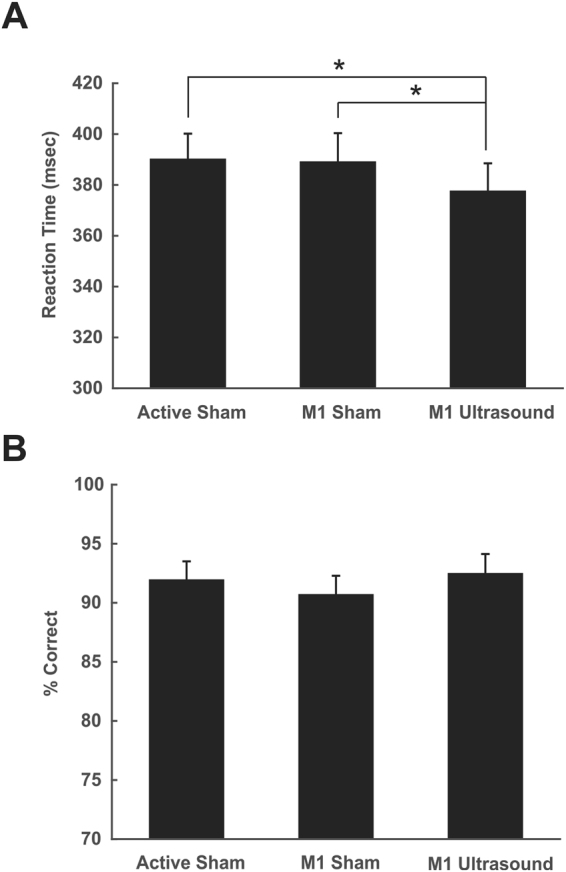
Figure 6.

Effect of ultrasound on motor behavior. (A) Group average (N = 28) reaction time ± SEM in milliseconds (msec) to a stimulus response task. Active sham represents ultrasound delivered to the vertex. M1 sham represents transducer over primary motor cortex (M1) but no ultrasound. M1 tFUS is transcranial focused ultrasound to primary motor cortex. *Denotes p < 0.05. (B) Data from catch trials during the reaction time task. Data is represented as percent correct ± SEM.
