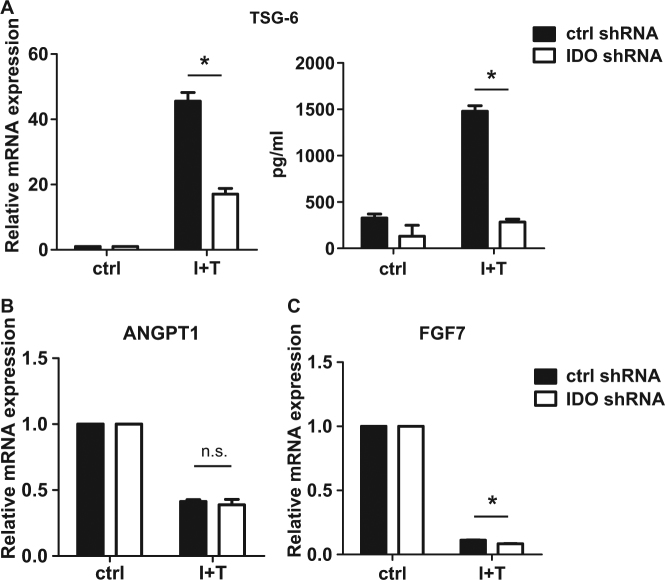
Fig. 2.
IDO knockdown suppresses TSG-6 production by hUC-MSCs. a IDO-KD MSCs and control cells were treated with IFN-γ and TNF-α (10 ng/ml each) for 24 h and levels of TSG-6 mRNA (left) and protein (right) were examined by real-time PCR and ELISA of the culture supernatant, respectively. b, c Similarly, Ang-1 (b) and KGF (c) mRNA levels were measured in these cells. All sample transcript levels were normalized to the level of housekeeping gene β-actin, and the relative levels were calibrated to the ctrl value. Bars indicate mean ± SEM. *P < 0.05 based on a Student’s t-test. All graphs show the average of three independent repeats, unless otherwise noted

