Figure 3.
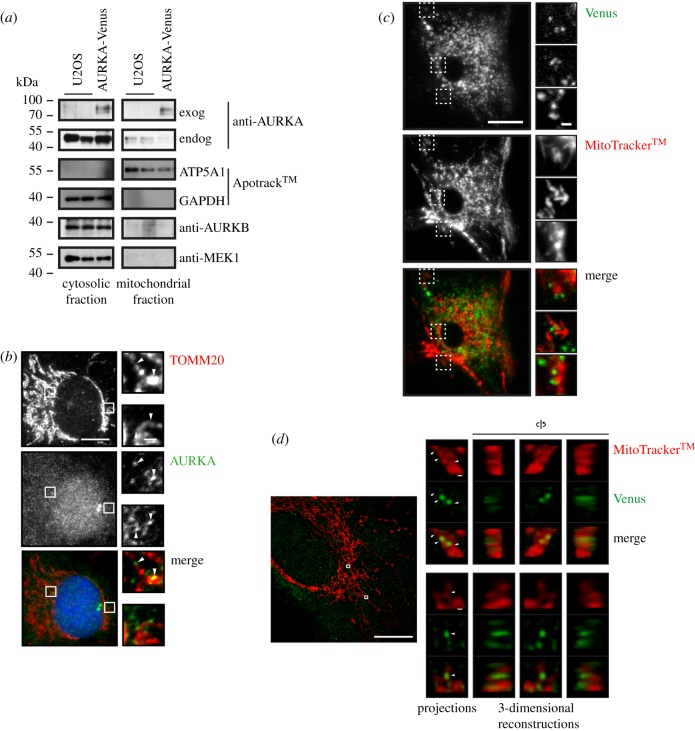
A mitochondrial fraction of AURKA. (a) U2OS and U2OS-AURKA-Venus cells were fractionated by serial centrifugation and probed for the presence of exogenous (exog) and endogenous (endog) AURKA, and of specific markers for cytosolic (GAPDH, MEK1) or mitochondrial (ATP5A1) fractions, by immunoblot. (b) Co-localization of endogenous AURKA (green) and mitochondrial marker TOMM20 (red) examined by IF in RPE-1 cells. (c) Live cell imaging of endogenously tagged RPE-1 mVenus-AURKA knock-in (KI) cells stained with MitoTrackerTM to examine co-localization. (d) RPE-1-AURKA-Venus cells were treated with MitoTrackerTM 24 h after induction of AURKA-Venus expression, then methanol-fixed, stained using GFP antibody and imaged on an OMX system. The image shown is a maximum-intensity projection of a 12 × 0.125 µm stack, with 10-fold magnification of insets. For panels (b,c): scale bars, 10 µm in main panels, 1 µm in magnification panels. For panel (d): scale bars, 10 µm in main panels, 100 nm in magnification panels.

