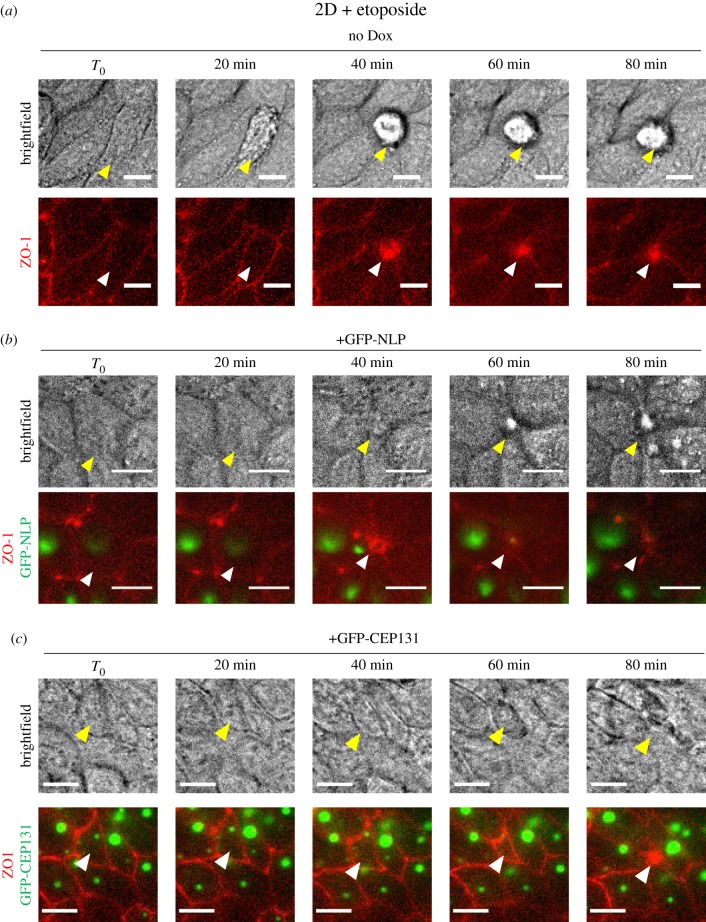
Figure 2.
Monitoring of apical and basal extrusion by time-lapse microscopy. Still series from time-lapse experiments performed on 2D MDCK monolayer cultures (expressing mCardinal-ZO-1 and the indicated transgenes). Cells were induced to express transgenes for 48 h and then treated with etoposide. (a) Control MDCK cells (no Dox); (b) MDCK cells expressing GFP-NLP; (c) MDCK cells expressing GFP-CEP131. Time lapse was started immediately after etoposide addition and images were acquired every 20 min. T0 was arbitrarily defined as the first frame prior to clear evidence for the onset of cell extrusion. Upper panels show brightfield images (top views), illustrating the directionality of cell extrusion. Note that extruded cells appear above the monolayer only in case of apical extrusion (a), but not in case of basal extrusion (b) and (c); extruding cells are marked by yellow arrowheads. Lower panels show corresponding fluorescence images (GFP-NLP or GFP-CEP131 in green and mCardinal-ZO-1 in red), illustrating closure of ZO-1 junctions (white arrowheads). Scale bars = 10 µm.

