Fig. 2.
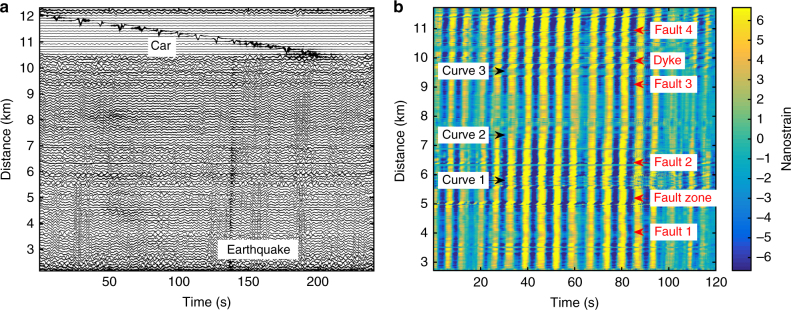
DAS records. a 4 min of strain signal (17 March 2015, 12:33–12:37). Only selected normalized traces (one trace out of 25, i.e. one trace every 100 m, frequency range 0.01–100 Hz) are shown. A local earthquake is revealed by higher frequencies in the signal from 135 to 140 s. Coherent oscillations of 5–6 s period correspond to ocean-driven micro-seism. Traces between 10.5 and 11.6 km with large amplitude signals correspond to a car travelling on the road along the cable (Methods: Shallow sub-surface crustal properties determination). b 2 min of strain record (19.03.2015, 15:27 UTC) showing micro-seism (4–6 s period) propagating from the south coast northwards along the cable. Beamforming computation (from the DAS record) indicates a source in the Atlantic Ocean, SW of Iceland. Changes in cable direction along the road (black labels) induce a change in the incidence angle of the micro-seism waves, and therefore amplitude change. Amplitudes and phases are disturbed at specific locations (indicated by the red labels), which correspond to geological features such as faults or volcanic dykes (Fig. 1)

