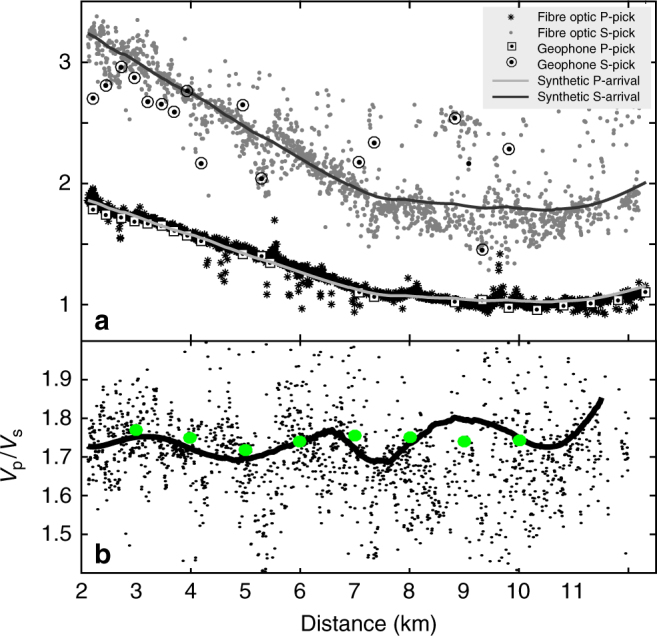
Fig. 6.

Exploration studies using conventional seismological methods and a fibre-optic telecommunication line. a P- and S-waves’ travel times automatically picked along the profile: each symbol represents a P- (black star) and S- (grey dots) arrival times on the DAS records. The white squares with black dot and the white circle with black dot correspond to P- and S-wave travel times, respectively, picked on the geophone records with the same automatic picker. The continuous grey (black) lines correspond to theoretical arrival times for the inverted hypocentre using P- and S-wave picks from the cable (respectively). b Observed Vp/Vs ratio computed at all traces and compared with the results obtained from the travel time tomography (green dots) obtained from more than 2000 local earthquakes over 1.5 years41. The black line corresponds to the polynomial (Savitsky–Golay) smoothing filter of order 5 with size frame ~3 km long through the fibre-optic Vp/Vs individual values
