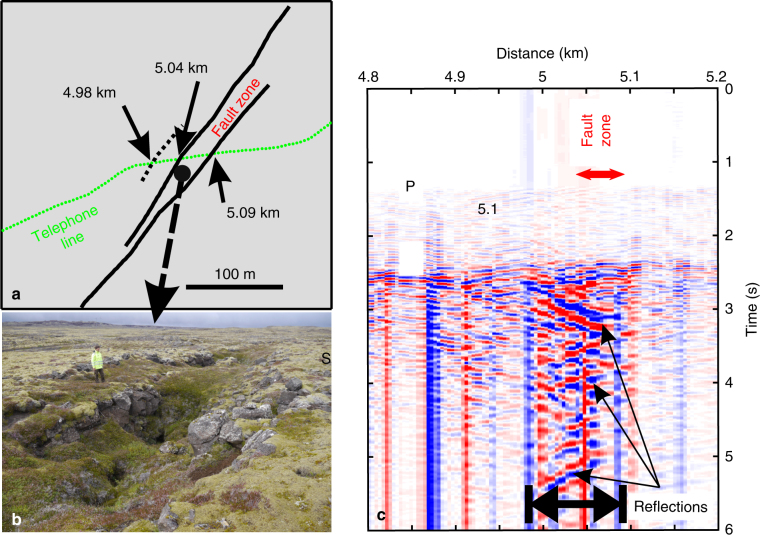
Fig. 7.
Structure of a fault damage zone within an active geological rift. a The road and the cable (distance ~5 km) cross several faults, e.g. a clearly visible fault zone with more loose material in the field (between 5.04 and 5.09 km). b The fault damage zone is visible by the ~50–60 m wide depression area (picture taken at ~100 m SW of the road, looking towards SW). Note that at the cable location no depression area is visible. The depression is only the surface expression at the position of the picture (Picture Martin Lipus, GFZ). c Short record (6 s) of strain phases from a local earthquake (Fig. 5) trapped in the fault damage zone. Phases are reflected until ~4.98 km, which may indicate a hidden fault with surface expression. Waves inside and outside the fault zone have different apparent velocities

