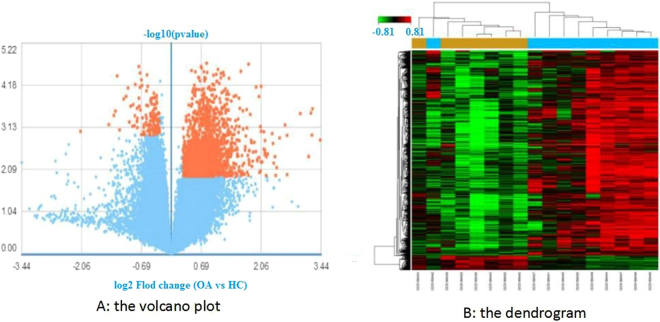
Figure 1.
(A) The volcano plot. Orange represents DEGs; the downregulated DEGs are on the left side of the midline, and the upregulated DEGs are on the right. OA represents osteoarthritis patients; HC represents healthy controls. (B) The dendrogram. Profiles of DEGs in synovitis of OA. Data of mRNA were clustered using GCBI (P < 0.05). In total, 1941 DEGs were determined compared to the HC group (yellow). The OA group is blue, and the HC group is yellow.

