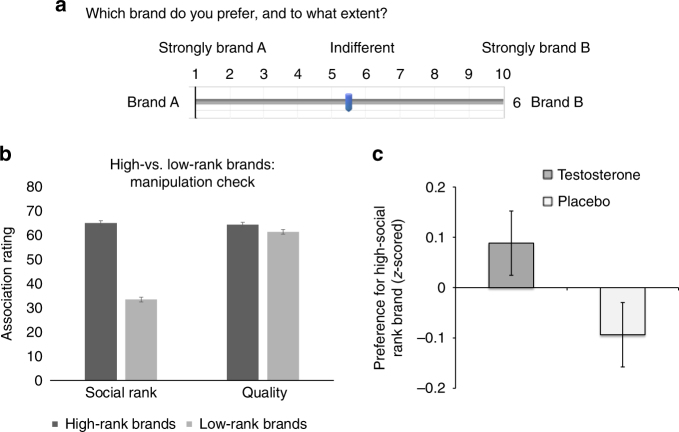
Fig. 2.
Task to assess preference for brands high versus low in social rank and results. a Preference task showing the setup and main dependent variable. b Mean social rank and quality association ratings of brands pre-classified based on a pretest as high vs. low rank, by main study participants (N = 243); perceived differences in social rank associations between the brands were substantially greater than the difference in perceived quality. c Mean preference toward the high (versus low) social rank brands for the two treatment groups (z-scored at the pair level). Error bars denote s.e.m. For the corresponding dot plot, see Supplementary Fig. 2

