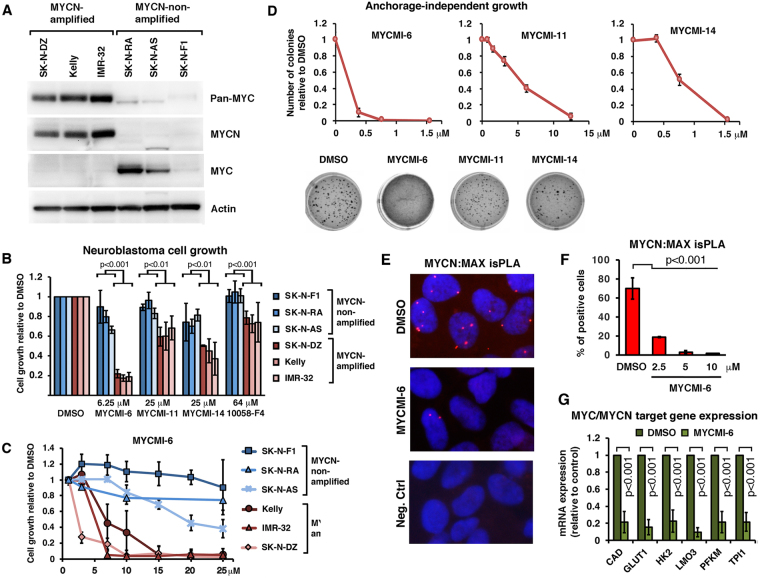
Figure 5.
MYCMIs preferentially inhibit growth of MYCN-amplified compared to non-amplified neuroblastoma cells correlating with MYC family protein expression. (A) Western blot analysis of MYCN, MYC and pan-MYC protein expression in MYCN-amplified neuroblastoma cells (IMR-32, Kelly and SK-N-DZ) and MYCN-non-amplified neuroblastoma cells (SK-N-F1, SK-N-AS and SK-N-RA). Pan-MYC antibodies recognizing all MYC family proteins or antibodies specific for MYCN or MYC (see Supplementary Information), respectively, were used as indicated. Full length versions of the gels are presented in Suppl. Fig. S10. (B) Indicated neuroblastoma cell lines were treated with MYCMI-6 (6.25 μM), MYCMI-11 and MYCMI-14 (25 μM), reference compound 10058-F4 (64 μM) or DMSO control for 48 hours after which cell growth/viability was measured by the resazurin assay. Data are shown as mean ± standard deviation of 2–5 biological repeats. p-values are indicated. (B) Titration of MYCMI-6 onto three MYCN-non-amplified and three MYCN-amplified cell lines as indicated for 48 hours followed by the resazurin assay. (C and D) Anchorage-independent cell growth of MYCN-amplified neuroblastoma cells. (C) Anchorage-independent growth of neuroblastoma SK-N-DZ cells in 0.35% agarose in 24 well plates in the presence of DMSO or compounds at indicated concentrations. After 16 days, colonies were stained with MTT and the numbers of colonies were counted. Images of colonies in wells treated with 0.75 μM of compound, analyzed after two weeks, are displayed (lower panel). (E and F), visualization of endogenous MYCN:MAX interaction by isPLA in MYCN-amplified SK-N-BE(2) cells, performed as described in the legend to Fig. 2 using MYCN and MAX antibodies. (E) Images of the isPLA assay. The cells were treated with MYCMI-6 (2.5 µM) or DMSO for 16 hours. As negative control, one primary antibody was used together with the pair of secondary antibodies. (F) Quantification of MYCN:MAX isPLA, representing the average percentage of cells displaying MYCN:MAX nuclear dots from three microscopic fields after treatment with MYCMI-6 at indicated concentrations for 16 hours normalized to corresponding values for DMSO-treated cells. p-values are indicated. (G) RT-qPCR analysis of mRNA expression of selected MYC/MYCN target genes47, in MYCN-amplified Kelly cells after treatment with MYCMI-6 (2.5 μM) or DMSO for 24 hours. The analysis is based on three biological experiments with three technical repeats each. Fold changes in mRNA expression in response to MYCMI-6 are presented relative to DMSO after normalization to total RNA per cell. p-values are indicated.

