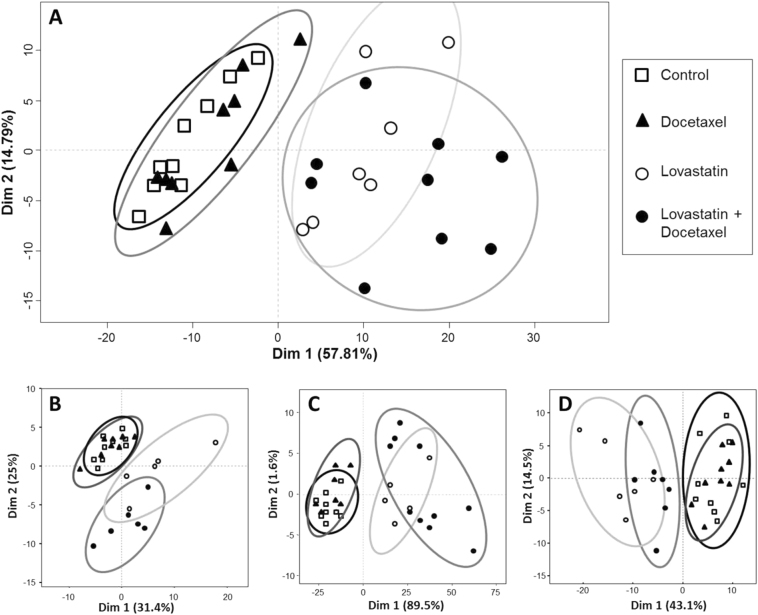
Fig. 1.
Representative score plots of the Principal Component Analysis (PCA) from metabolomics and lipidomics analyses. Score plots of the metabolomics MS data acquired in the negative mode on the LC-MSn°2 platform (A), the LC-MSn°1 platform in the positive mode (B), the GC-MSn°1 platform (C), and the NMRn°1 platform (D). Experimental conditions: control (open squares), docetaxel (plain triangles), lovastatin (open circles), and lovastatin + docetaxel (plain circles). Cells were treated for 36 h. The two dimensions of the analysis and their contribution to the variance are indicated. The data are representative of results from all platforms

