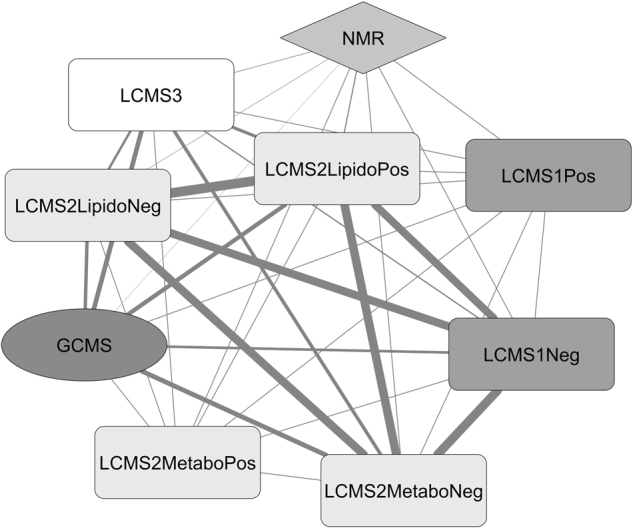
Fig. 2.

Inter-platform correlation network. The network was established using the RV scores between all the data matrices generated by the 5 analytical platforms. The thickness of the links reflects the concordance level in metabolite identification between platforms. The LC-MSn°1 was used in the positive (LCMS1Pos) or negative (LCMS1Neg) modes; the LC-MSn°2 was used in the metabolomics positive (LCMS2MetaboPos) or negative (LCMS2MetaboNeg) modes or in the lipidomics positive (LCMS2LipidoPos) or negative (LCMS2LipidoNeg) modes
