Fig. 5.
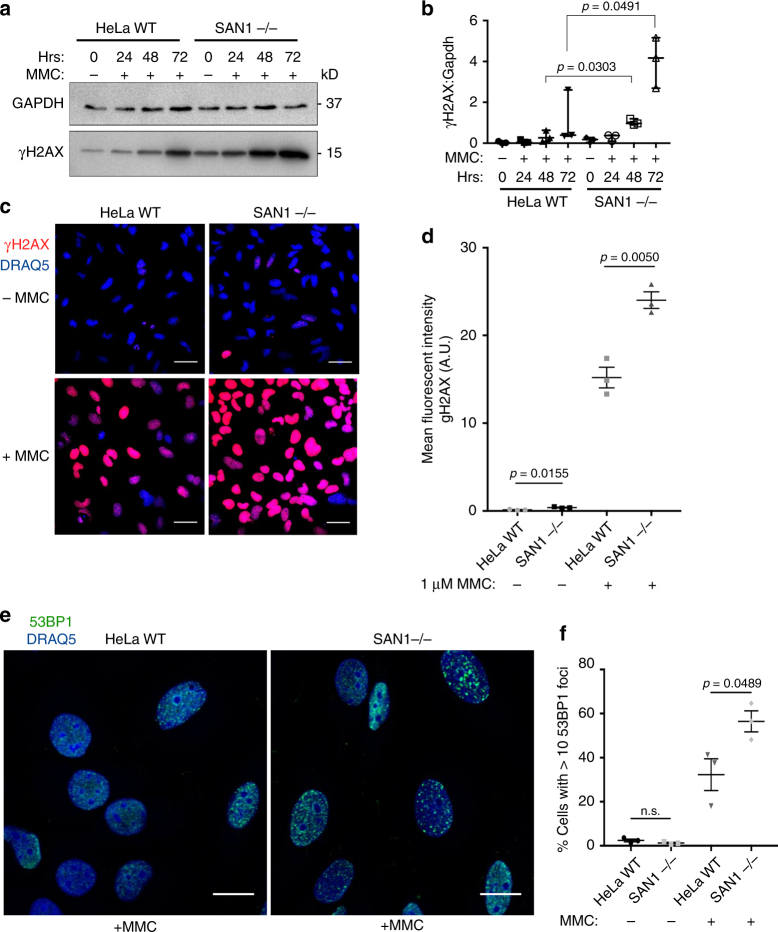
Increased levels of DNA damage in SAN1−/− cells exposed to MMC. a Immunoblots of γH2AX from HeLa WT and SAN1−/− cells treated for various times with vehicle or 0.045 μM MMC. GAPDH was a loading control. b Quantification of immunoblot time course (N = 3). Statistical significance determined by t-test with Welch’s correction. c Immunofluorescence (IF) staining of γH2AX and DNA (Draq5) 30 hrs after treatment with vehicle or 1 μM MMC. d Quantification of γH2AX intensity in vehicle and MMC treated HeLa WT and SAN1−/− cells. Statistical significance determined by t-test with Welch’s correction (N = 3 biological replicates, at least 250 cells per sample were analyzed). e IF staining of 53BP1 and DNA (Draq5) 30 h post-treatment with vehicle or 1 μM MMC. f Quantification of percentage of cells with >10 53BP1 foci in HeLa WT and SAN1−/− cells. Statistical significance determined by unpaired t-test (N = 3 biological replicates, at least 200 cells per sample were analyzed)

