Figure 2.
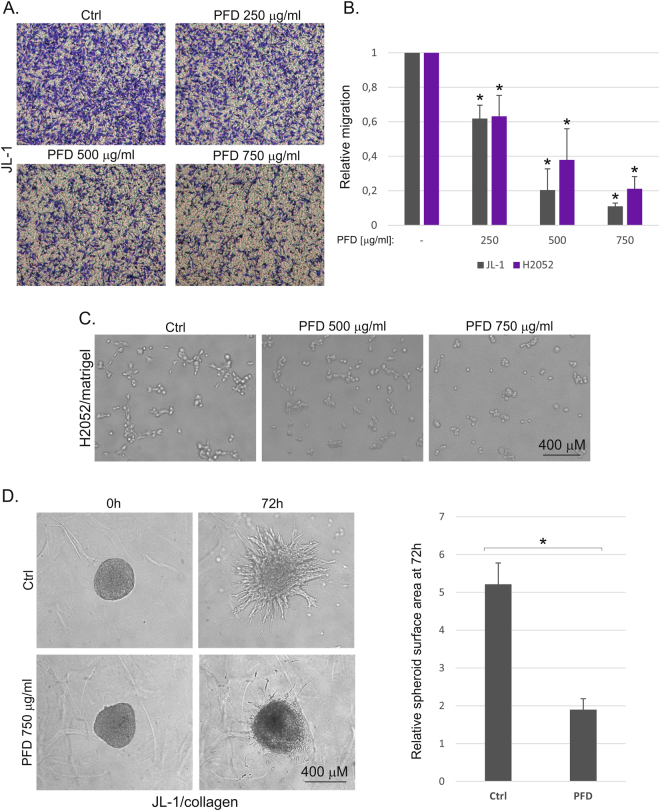
Pirfenidone reduces mesothelioma cell migration and 3D invasive growth. (A) Invasive migration was analyzed using collagen 1 coated Transwell inserts. Control or pirfenidone (PFD) treated migrated cells were fixed, stained and imaged 16 hours after seeding. Representative images of crystal violet stained JL-1 cells are shown. (B) Invasive migration of JL-1 and H2052 cells 16 hours after seeding is shown. Graphs represent quantification of relative migration. The error bars represent SD (n = 3). *p < 0.05. (C) H2052 cells were embedded into 3D Matrigel matrix. Images of control and pirfenidone (PFD) treated cells from a representative experiment are shown. (D) Invasive growth of control or pirfenidone (PFD) treated JL-1 cells was analyzed in 3D collagen 1 matrix. Cells were followed up to 72 hours. Representative images are shown. Graph shows quantification as relative spheroid surface area. The error bars represent SD (n = 3). *p < 0.05.

