Figure 3.
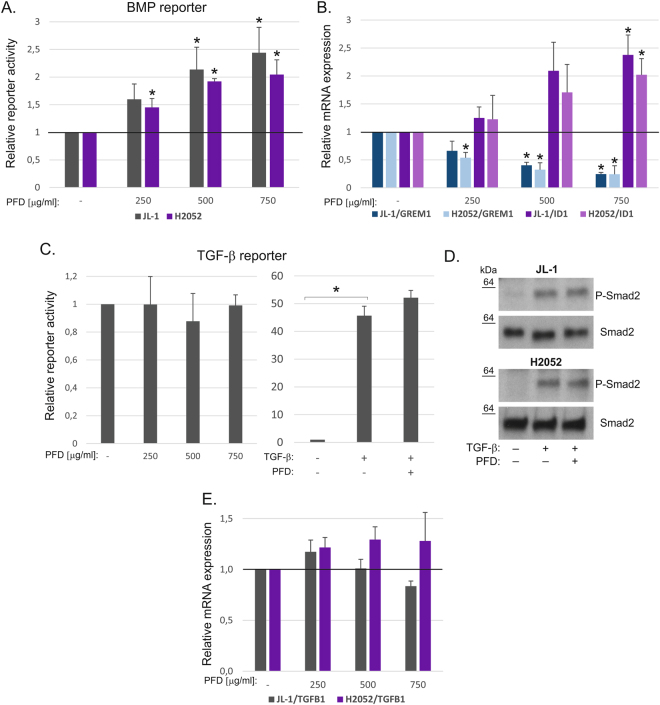
Increased BMP pathway activity in pirfenidone treated cells. (A) BMP [(Bre)2-luc] pathway activity was analyzed using a promoter reporter assay. Promoter activities in pirfenidone (PFD) treated cells are shown relative to the level in each control (JL-1 or H2052), which was set to 1. The error bars represent SD (n = 3). *p < 0.05. (B) Expression of ID1 and GREM1 genes in pirfenidone (PFD) treated JL-1 and H2052 cells. The results are expressed relative to each control, which was set to 1. The error bars represent SD (n = 3). *p < 0.05. (C) TGF-β [(CAGA)12-luc] pathway activity was analyzed in H2052 cells using a promoter reporter assay. Promoter activities in pirfenidone (PFD, 750 μg/ml) and/or TGF-β1 (0.5 ng/ml) treated cells are shown relative to the level in control, which was set to 1. (D) Pirfenidone (PFD, 750 μg/ml) and TGF-β1 (0.5 ng/ml) treated JL-1 and H2052 cell lysates were analyzed by Western blotting using antibodies specific to P-Smad2 and Smad2. The molecular weight markers (kDa) are shown on the left. The western blots were derived under the same experimental conditions from the same cell lysate of each treatment group (JL-1 and H2052). (E) Expression of TGFB1 gene in pirfenidone (PFD) treated JL-1 and H2052 cells. The results are expressed relative to each control, which was set to 1. The error bars represent SD (n = 3).

