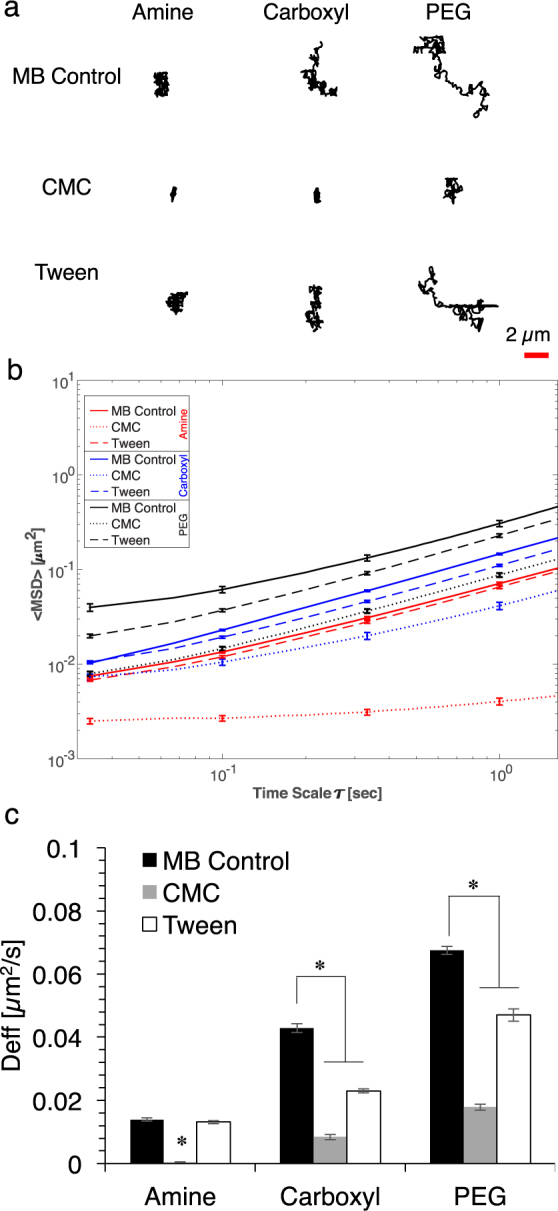
Figure 3.

(a) Representative trajectories of Amine, Carboxyl, and PEG particles dosed in MB Control, CMC, and Tween to mucus. Scale bar: 2 µm. (b) Mean square displacements (<MSD>) as a function of time scale for particles dosed with MB Control, CMC, and Tween. Error bars represent SEM. (c) Effective diffusivity (Deff) of particles dosed with MB Control, CMC, and Tween at time scale of τ = 3 sec. Error bars represent SEM and ANOVA was used to determine significance, where * indicates p < 0.05 compared to respective control.
