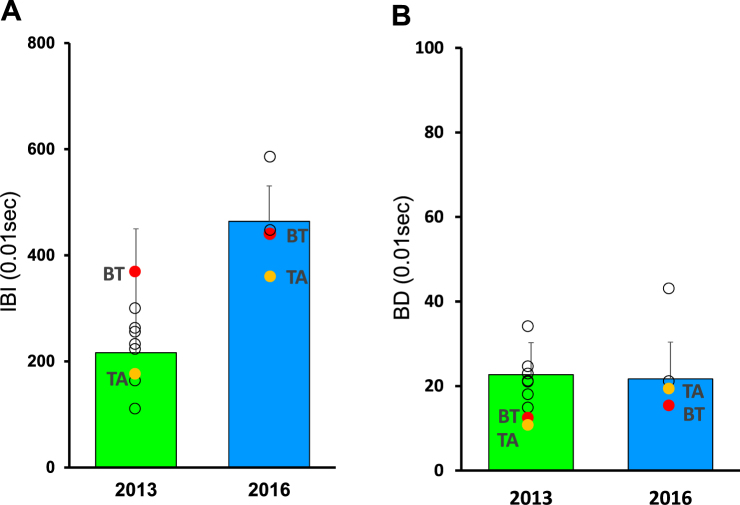
Figure 4.
Group size, and the inter-blink interval (IBI) and blink duration (BD) of individual adult males. (A) Weighted average value of the inter-blink interval of 9 adult males in 2013 and of 4 adult males in 2016. (B) Weighted average value of the blink duration of 9 adult males in 2013 and of 4 adult males in 2016. The whiskers show standard deviation of the weighted average value of adult males. The white circles indicate weighted average values of individual males. Two males, BT and TA, belonged to the AI group in both 2013 and 2016. The red and yellow circles indicate the weighted average values of BT and TA, respectively.

