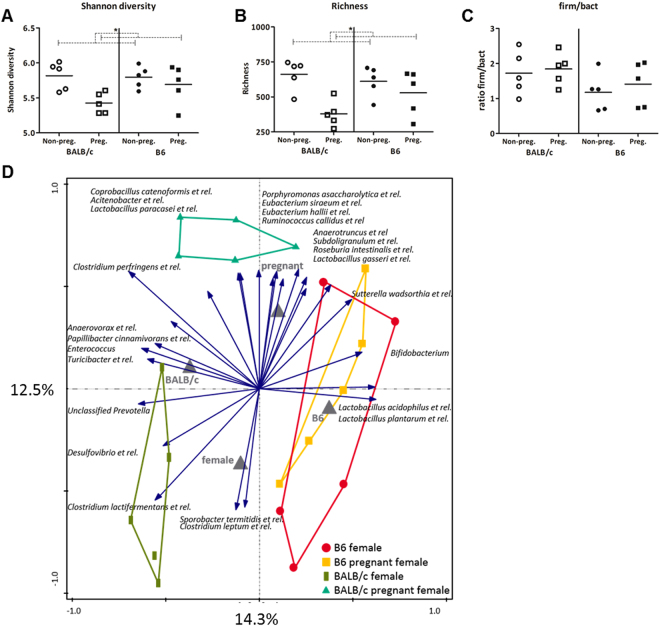
Figure 1.
Effect of pregnancy on fecal microbiota characteristics. Shannon diversity (A), richness (B) and the firmicutes/bacteroidetes ratio (C) in the fecal microbiota of pregnant and non-pregnant BALB/c and B6 (n = 5). Results are shown as dot plots + means and were tested for overall strain and pregnancy effects using a Two-way ANOVA, followed by a Bonferroni post-hoc test to test for strain specific pregnancy effects when interaction was found. Significant pregnancy effects are indicated with dashed lines (p < 0.05). RDA plot (D) showing the variation explained by the components genotype and pregnancy (n = 5). The total variation that can be explained by the variables genotype (14.3%) and pregnancy (12.5%) is 26.8%. Both variables are significant in explaining the variation (Monte Carlo permutation, p < 0.05).

