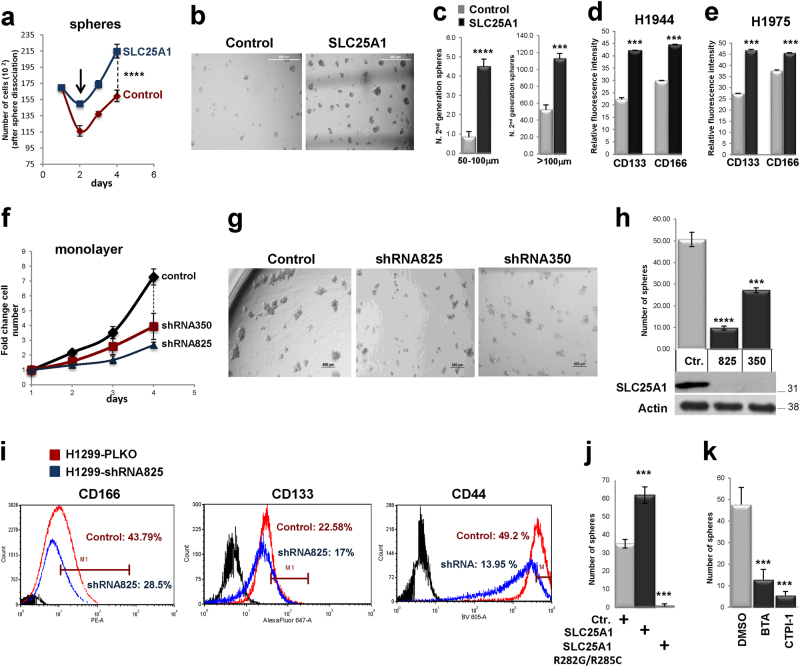
Fig. 2.
a Growth curves of H1299 or SLC25A1-expressing cells cultured as spheres, dissociated and counted at each of the indicated time points. The arrows indicate the loss of viability that occurs in the first days of sphere formation, likely reflective of differentiated cells dying by anoikis. b Control or SLC25A1-expressing cells were dissociated and plated as single spheres in semisolid media, methylcellulose. After 1 week, spheres were isolated, dissociated again and re-plated in the same conditions, producing second-generation spheres. c Quantification of the experiments shown in b. d, e FACS analysis of CD133 and CD166 in the indicated cell lines either mock transfected (gray bars) or transfected with the vector expressing SLC25A1 (black bars). f Growth curves of H1299 cells infected with lentivirus control shRNA, or with either of two SLC25A1 shRNAs (825 and 350). g, h Sphere-forming ability of H1299 cells infected with lentivirus control or with the indicated SLC25A1-shRNAs, dissociated and plated as single cells in semisolid media. i CD166 and CD44 expression in cells infected with PLKO control lentivirus or with lentivirus harboring the specific SLC25A1 shRNA. j, k Sphere-forming ability of cells expressing SLC25A1 wild-type or mutant SLC25A1R282G/R285C j, or treated with the SLC25A1 inhibitors BTA (2 mM) and CTPI (1 mM) k. Bars represent the standard deviation, asterisks refer to *P ≤ 0.05; **P ≤ 0.01; ***P ≤ 0.001; ****P ≤ 0.0001 by unpaired T-test

