Table 5.
Combined analogues.

| |||||
|---|---|---|---|---|---|
| Ring A | Ring B | hSUCNR1 | mSUCNR1 | ClogPb | |
| pEC50 (efficacy, %)a | |||||
| 28 |

|
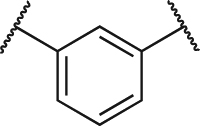
|
6.79 ± 0.12 (58.0 ± 2.7) | 5.92 ± 0.09 (64.0 ± 2.5) | 2.01 |
| 29 |

|
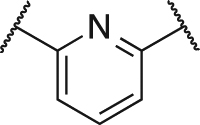
|
6.85 ± 0.19 (52.6 ± 3.9) | 6.74 ± 0.13 (71.2 ± 3.2) | 1.07 |
| 30 |

|
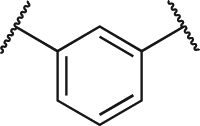
|
7.23 ± 0.14 (49.2 ± 2.7) | 5.84 ± 0.16 (45.3 ± 3.4) | 3.11 |
| 31 |

|
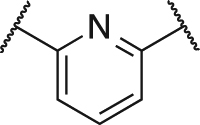
|
7.64 ± 0.13 (61.7 ± 2.5) | 6.75 ± 0.09 (69.9 ± 2.2) | 2.18 |
| 32 |

|
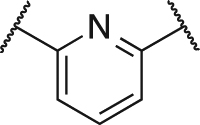
|
7.23 ± 0.23 (88.7 ± 6.1) | 7.00 ± 0.09 (68.1 ± 2.5) | 1.86 |
| 33 |

|
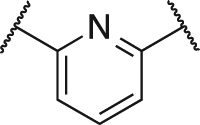
|
7.23 ± 0.37 (66.4 ± 7.2) | 7.29 ± 0.18 (61.5 ± 3.8) | 2.13 |
apEC50 values were determined from dose-response curves of induction of IP3 turnover in SUCNR1 transfected HEK cells (N = 3), efficacy is determined relative to succinate (100%). bCalculated by BioByte’s algorithm as implemented in ChemDraw Professional 16.0.1.4 (ClogP option).
