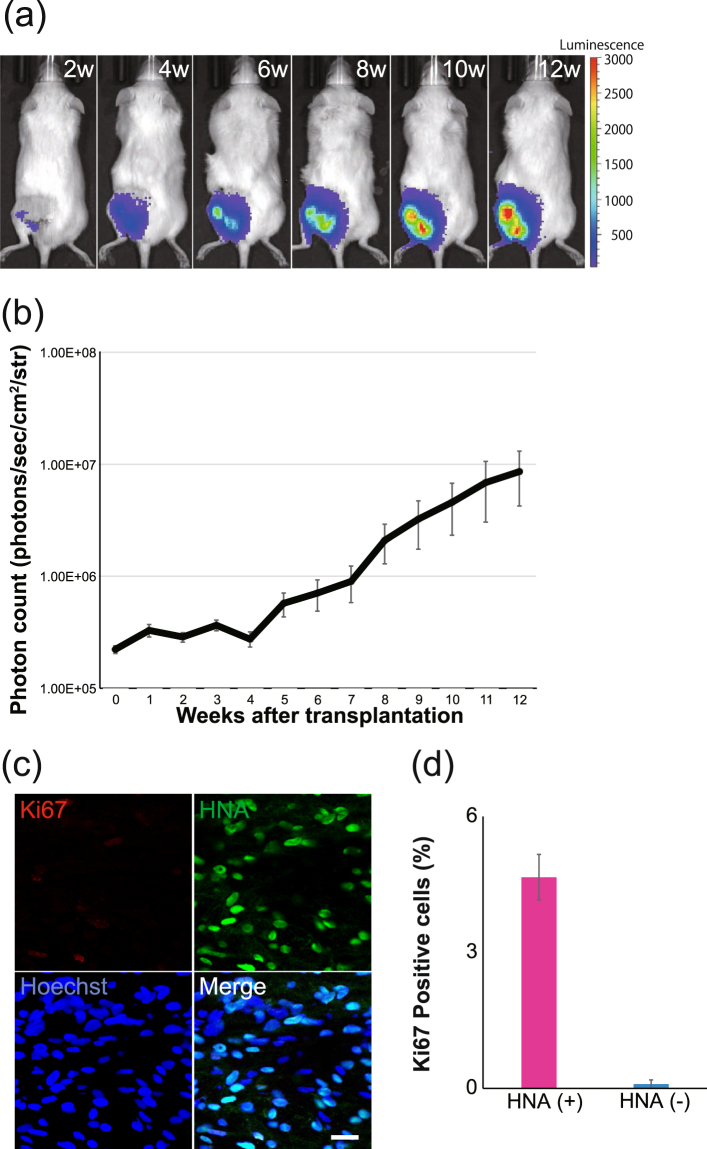
Figure 2.
Bioluminescence tracking of transplanted cells. (a) Representative bioluminescence images of the mouse at every two weeks after transplantation. Luminescence increased until 12 weeks after transplantation. (b) Quantitative analyses of the photon count derived from transplanted cells until 12 weeks. The in vivo survival and proliferation of transplanted cells were observed. (c) Fluorescence images of immunohistochemistry in the TP group performed with staining for HNA, Ki67, and Hoechst in sagittal sections at 12 weeks after transplantation. Scale bar, 50 µm. (d) Ki67-positive cells in HNA-positive and -negative cells were quantitatively analyzed. Most of the Ki67-positive cells were derived from human engrafted LT-NCLCs.

