Fig. 2.
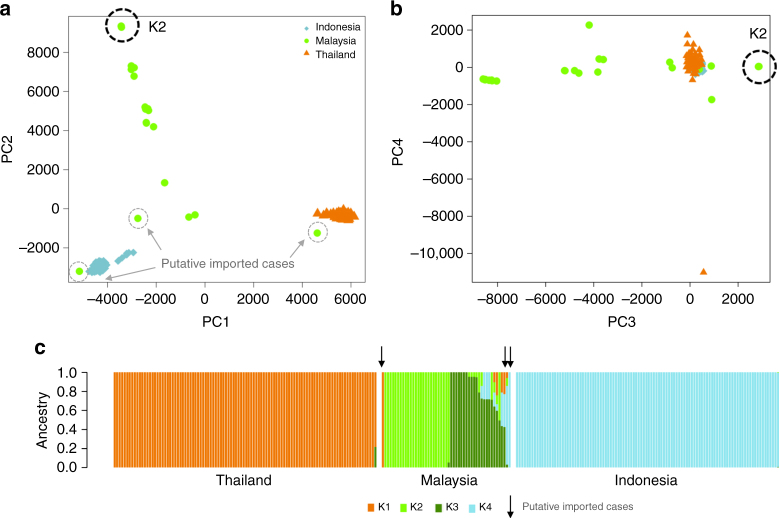
Plasmodium vivax population structure in Sabah relative to Thailand and Indonesia. a, b PCoA plots illustrating the genetic differentiation within and between populations. Principal components 1–4 reflect 17.6%, 11.7%, 3% and 1.3% of the variance, respectively. The genetically identical Malaysian K2 isolates are circled in black and the three putatively imported infections are circled in grey; the unlabelled green dots reflect the K3 and mixed ancestry infections which constitute the baseline Sabah population. Aside from the K2 strain, there is clear evidence of divergence among the baseline Sabah isolates. c An ADMIXTURE bar plot illustrating the population structure within and among populations at K = 4, highlighting the clear distinction between Thailand, Malaysia and Indonesia, and the marked sub-structure within Malaysia. All plots were generated using genomic data derived from 259 high-quality samples

