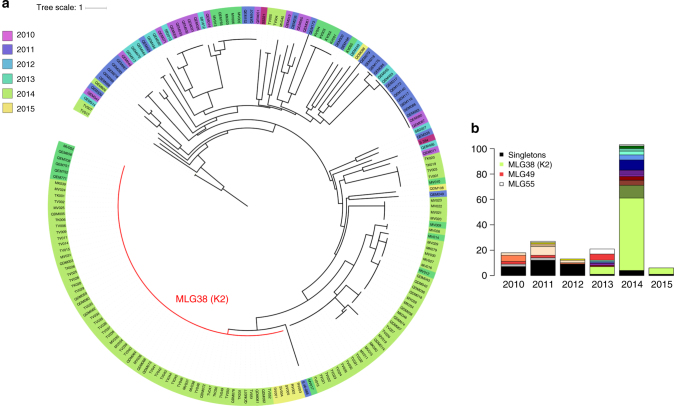
Fig. 6.
Temporal trends in the relatedness of Sabah P. vivax isolates using the microsatellite data. a A neighbour-joining tree illustrating trends in the relatedness of P. vivax infections between 2010 and 2015. Data are presented on 187 P. vivax isolates with complete MLGs across the nine microsatellite loci. b A bar plot illustrating temporal trends in the frequency of different MLGs between 2010 and 2015. Colour coding reflects distinct MLGs with the exception of singly observed (singleton) MLGs, which were grouped together for simple visual representation (back bars). MLG38 (genomic K2 strain) was the most frequent MLG observed in the dataset. MLGs 49 and 55 persisted for at least 4 years

