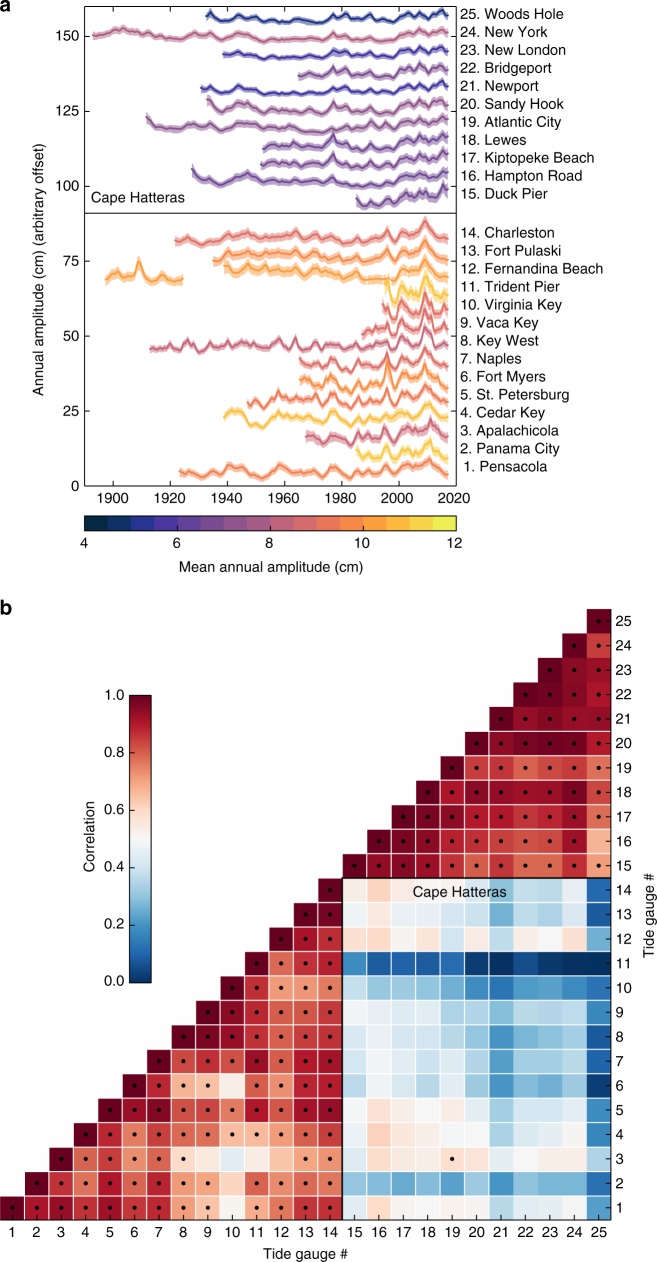
Fig. 1.
Amplitude from tide-gauge records. a Temporal changes in the amplitude of the SLAC from tide-gauge records along the United States Gulf and Atlantic coasts as estimated using a Bayesian state-space model. Solid lines denote the mean of the posterior distribution at each time step, whereas shaded areas represent the 68% (1-sigma) credible interval. The colors of the solid lines denote the time-mean value of the annual amplitude. The name of each station along with their identification number are also shown (see Supplementary Fig. 1 for tide-gauge locations). b Correlation matrix of the time series shown in a. Numbers along the axes represent tide-gauge identification numbers, whereas black dots denote significant correlation at the 95% confidence level

