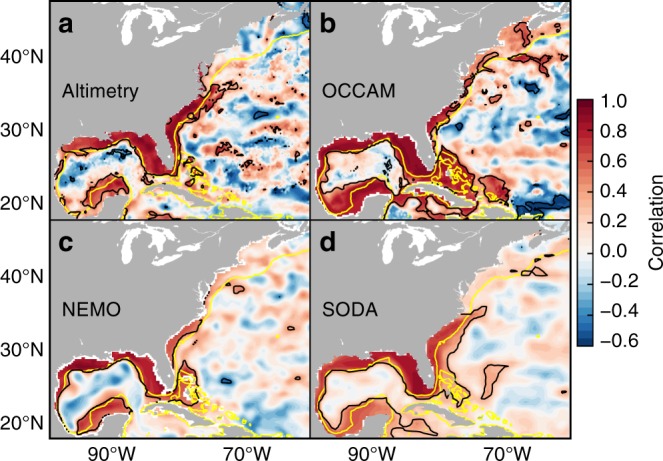
Fig. 4.

Correlation maps from satellite altimetry and ocean models. Point-wise correlation between the amplitude of the SLAC at each grid point and that averaged along the United States Gulf and Southeast coasts for a altimetry (1993–2016), b OCCAM (1985–2003), c NEMO (1968–2012), and d SODA (1900–2010). The average has been computed over grid points within the 0–500 m depth range following the coast from Pensacola to Charleston. Black line denotes significance of the correlation at the 95% confidence level, whereas yellow line represents the 500 m isobaths
