Fig. 5.

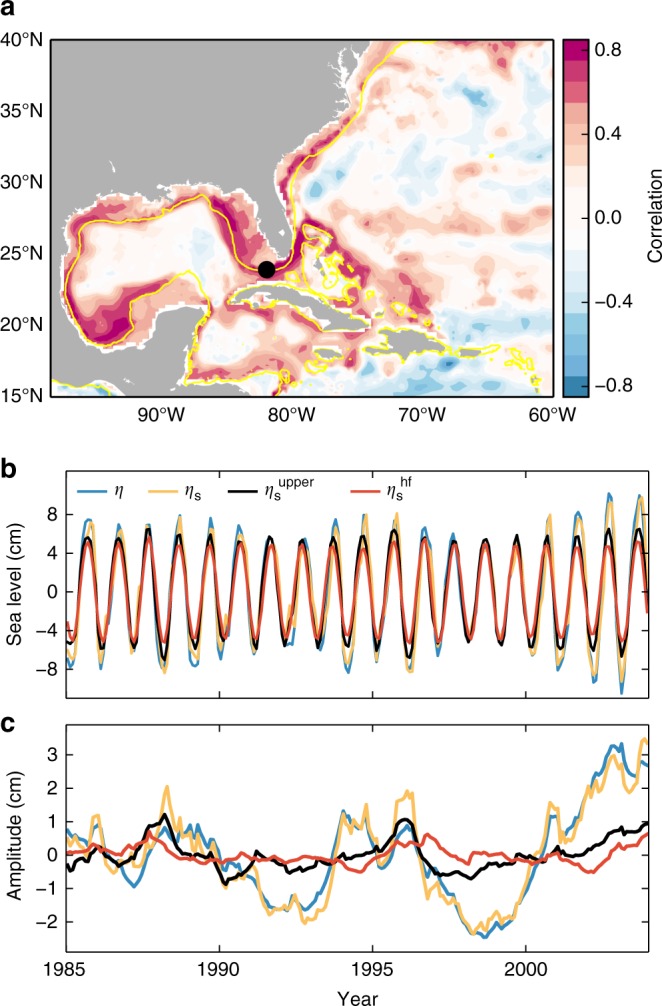
Correlation map and time series of the steric component from OCCAM. a Point-wise correlation of the steric annual amplitude at each grid point with the SLAC amplitude averaged along the United States Gulf and Southeast coasts. The average has been computed over grid points within the 0–500 m depth range following the coast from Pensacola to Charleston. The yellow line represents the 300 m isobath. b The annual cycle of total sea level (blue), total steric height (orange), and the steric contributions from above the seasonal thermocline (black) and due to surface heat fluxes (red) at the location denoted by the black dot shown in a. c The annual amplitude (time mean removed) of the time series shown in b
