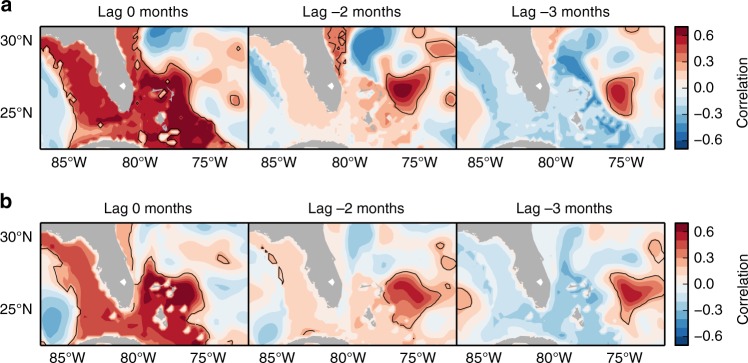
Fig. 6.
Lagged correlation maps of the steric contribution from below the seasonal thermocline. Point-wise lagged correlation of the steric contribution from 200 to 1000 m depth at the continental slope east of the Bahamas with that at each grid point for a OCCAM and b NEMO. Steric time series have been band-pass filtered (Butterworth filter with lower and higher cutoff frequencies: 1/16 and 1/8 months–1) to focus on the frequencies relevant to the SLAC modulator. For grid points in shallow areas (<200 m), the correlation is computed with the SLAC modulator instead of the steric. Negative lags indicate that steric changes at the slope east of the Bahamas lag relative to other grid points. Black line denotes significance of positive correlations at the 95% confidence level

