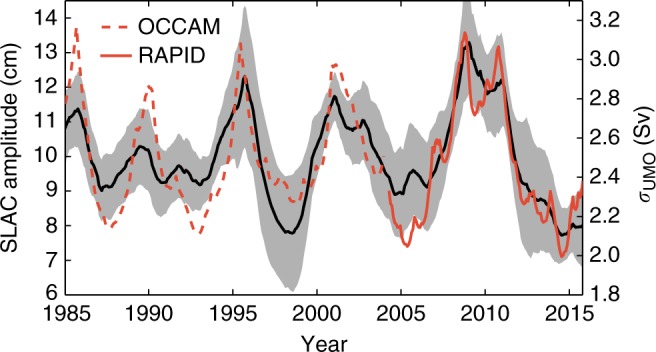
Fig. 9.

SLAC from tide-gauge records and the UMO transport. Instantaneous amplitude of the SLAC (left axis) averaged over tide-gauge stations 1–10 together with the instantaneous standard deviation of the UMO transport at 26.5°N (right axis) both from RAPID (red solid) and the OCCAM model (red dashed). The gray-shaded area denotes the standard deviation about the average annual amplitude of the 10 tide-gauge stations. A long-term trend has been removed from all time series
