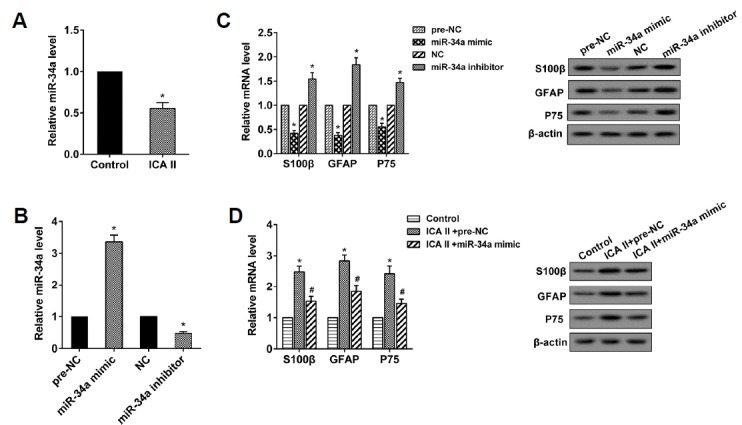
Fig. 2. ICA II promoted the differentiation of ADSCs to SCs through the inhibition of miR-34a.

(A) The miR-34a level was determined using qRT-PCR. *P < 0.05 vs. control. (B) The miR-34a level was determined using qRT-PCR. *P < 0.05 vs. pre-NC. *P < 0.05 vs. NC. (C) The expression levels of S100β, GFAP, and P75 mRNA and protein were analyzed through qRT-PCR and western blot, respectively. *P < 0.05 vs. pre-NC. *P < 0.05 vs. NC. (D) The expression levels of S100β, GFAP and P75 mRNA and protein were analyzed through qRTPCR and Western blot, respectively. *P < 0.05 vs. control. # P < 0.05 vs. ICA II+pre-NC.
